Step 1: Adding a Data Source Node
Every Data Function starts with retrieving data. The Data Source Node is the first building block you'll add to your function's flowchart. Its purpose is to specify which Decode Table contains the data you want to include in your analysis.
Adding the Node
- Create or Edit a Function: Start by creating a new function or editing an existing draft. This will open the Function Builder with a blank canvas or your existing flowchart.
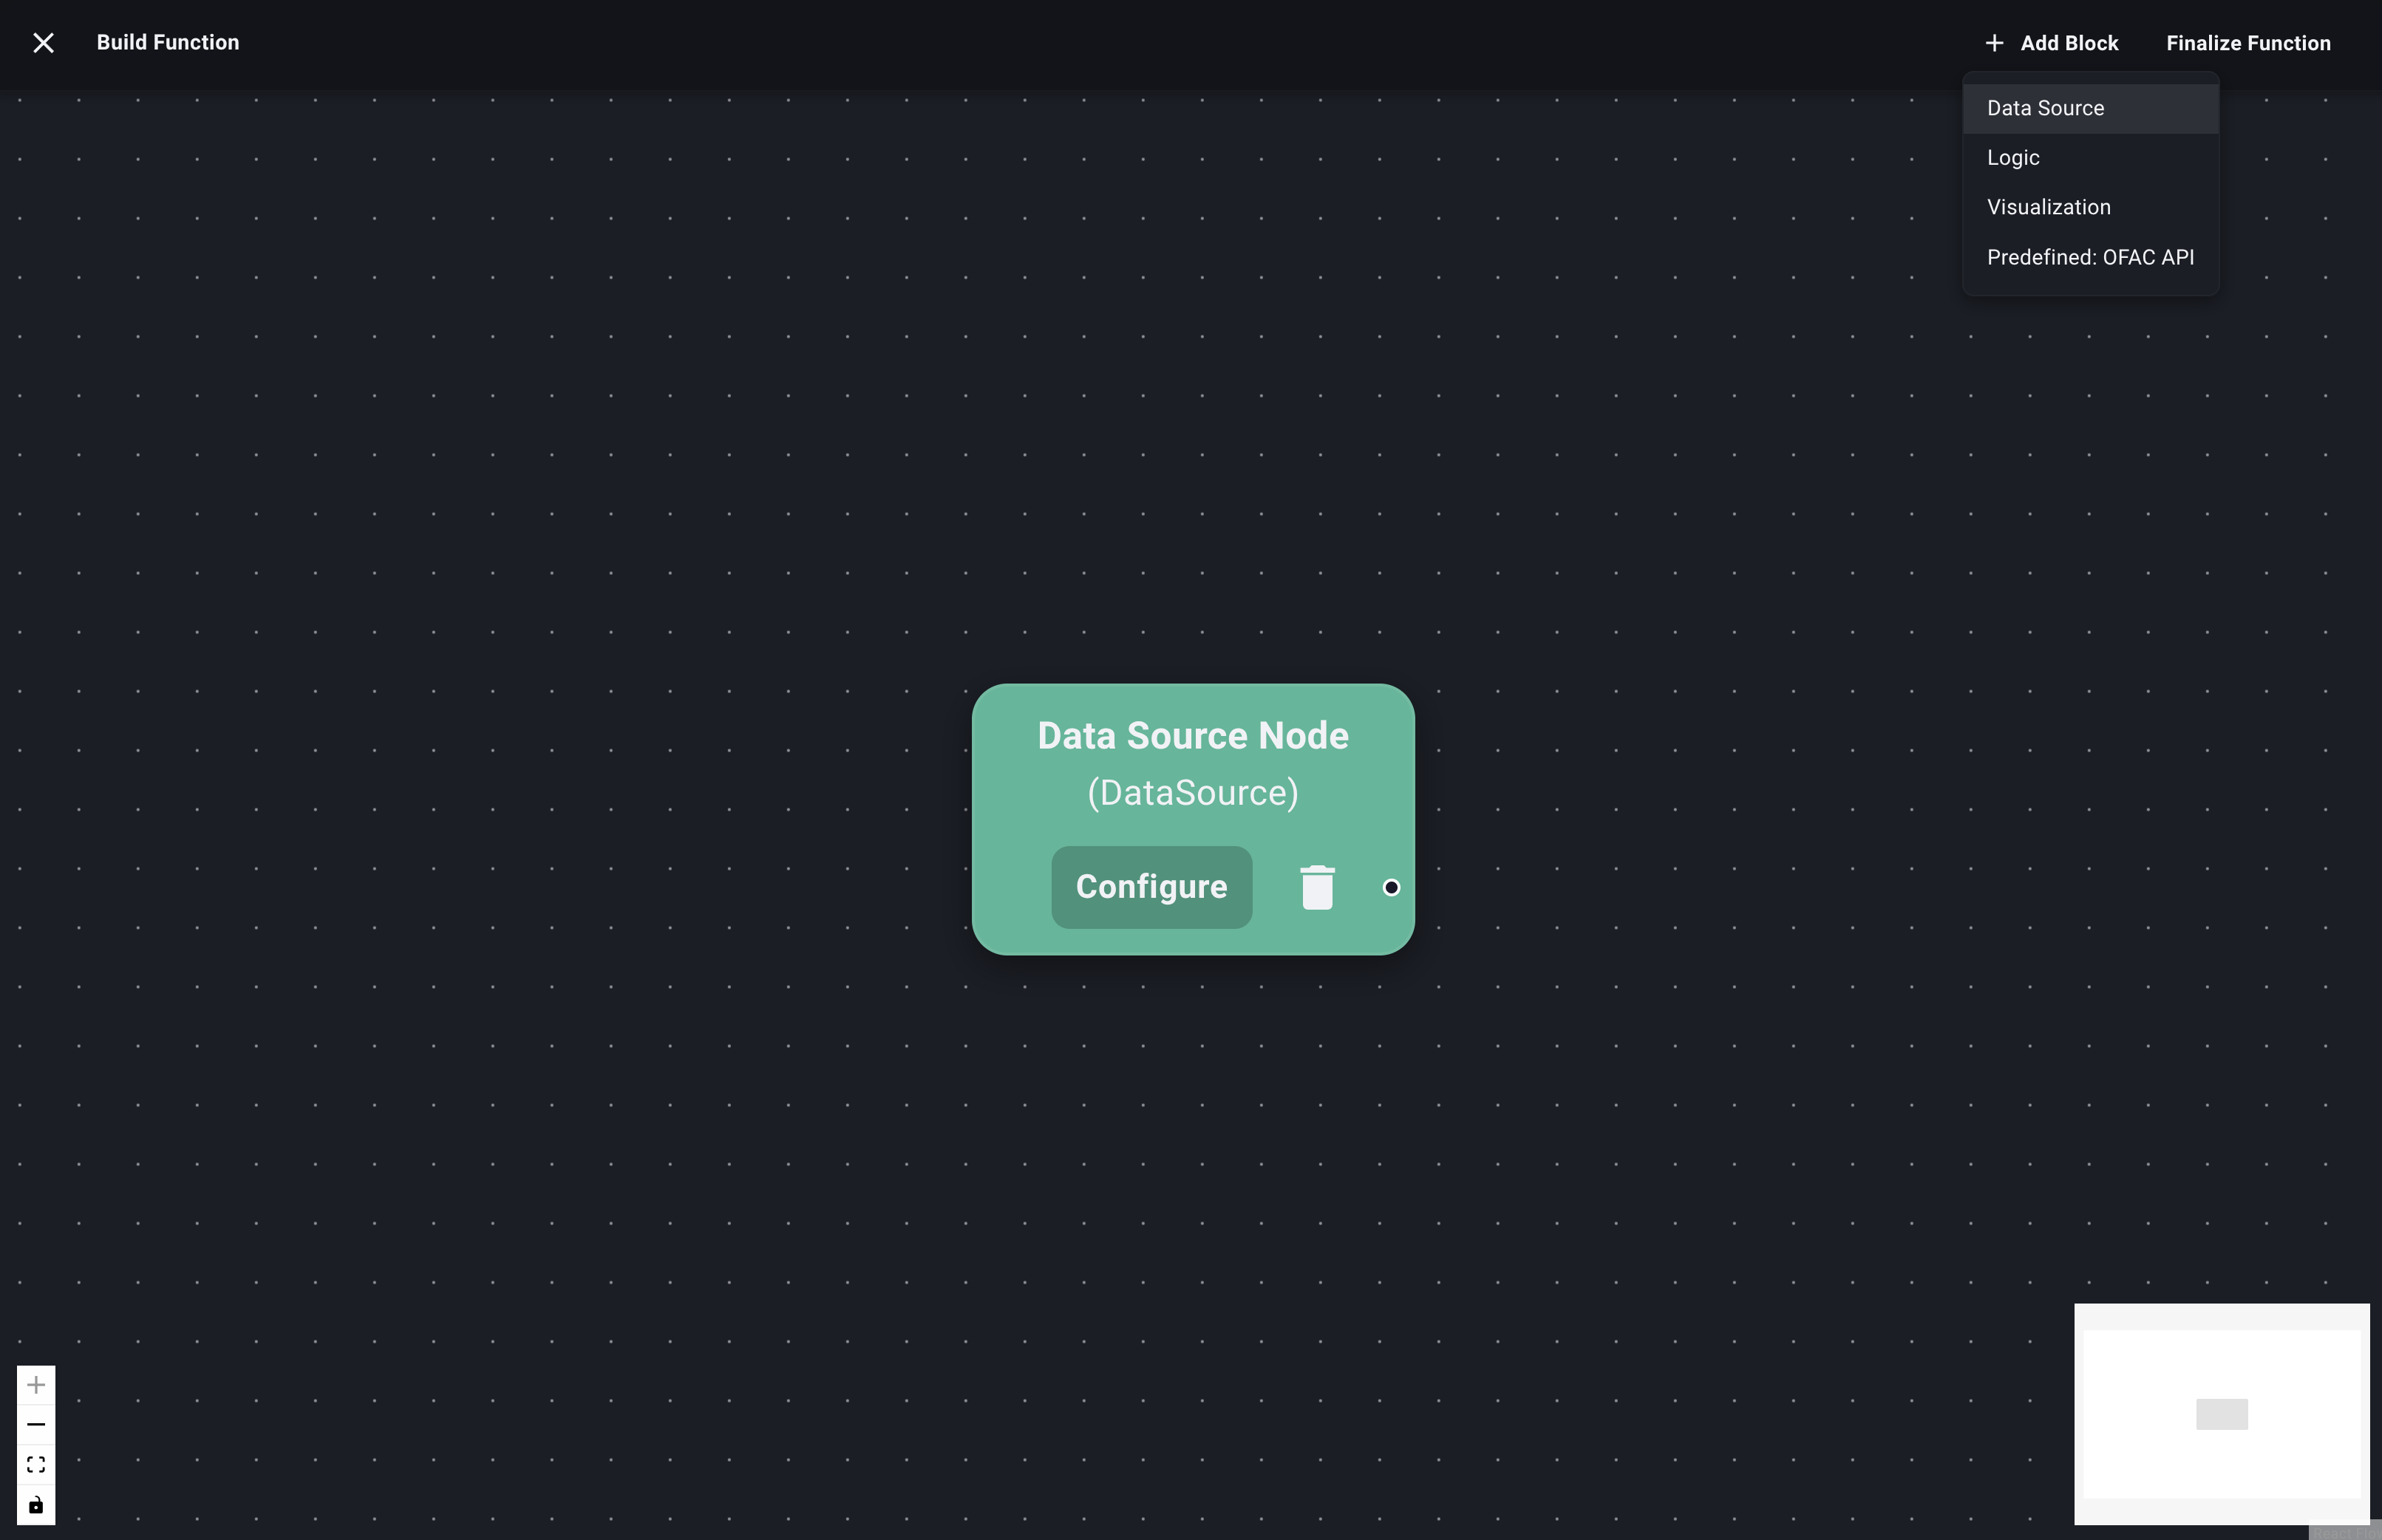
- Open the "Add Block" Menu: Click the "Add Block" button (found in the header or toolbar of the builder).
- Select "Data Source": Choose "Data Source" from the dropdown menu.
- A new Data Source node will appear on the canvas.
Configuring the Data Source Node
Newly added nodes need configuration.
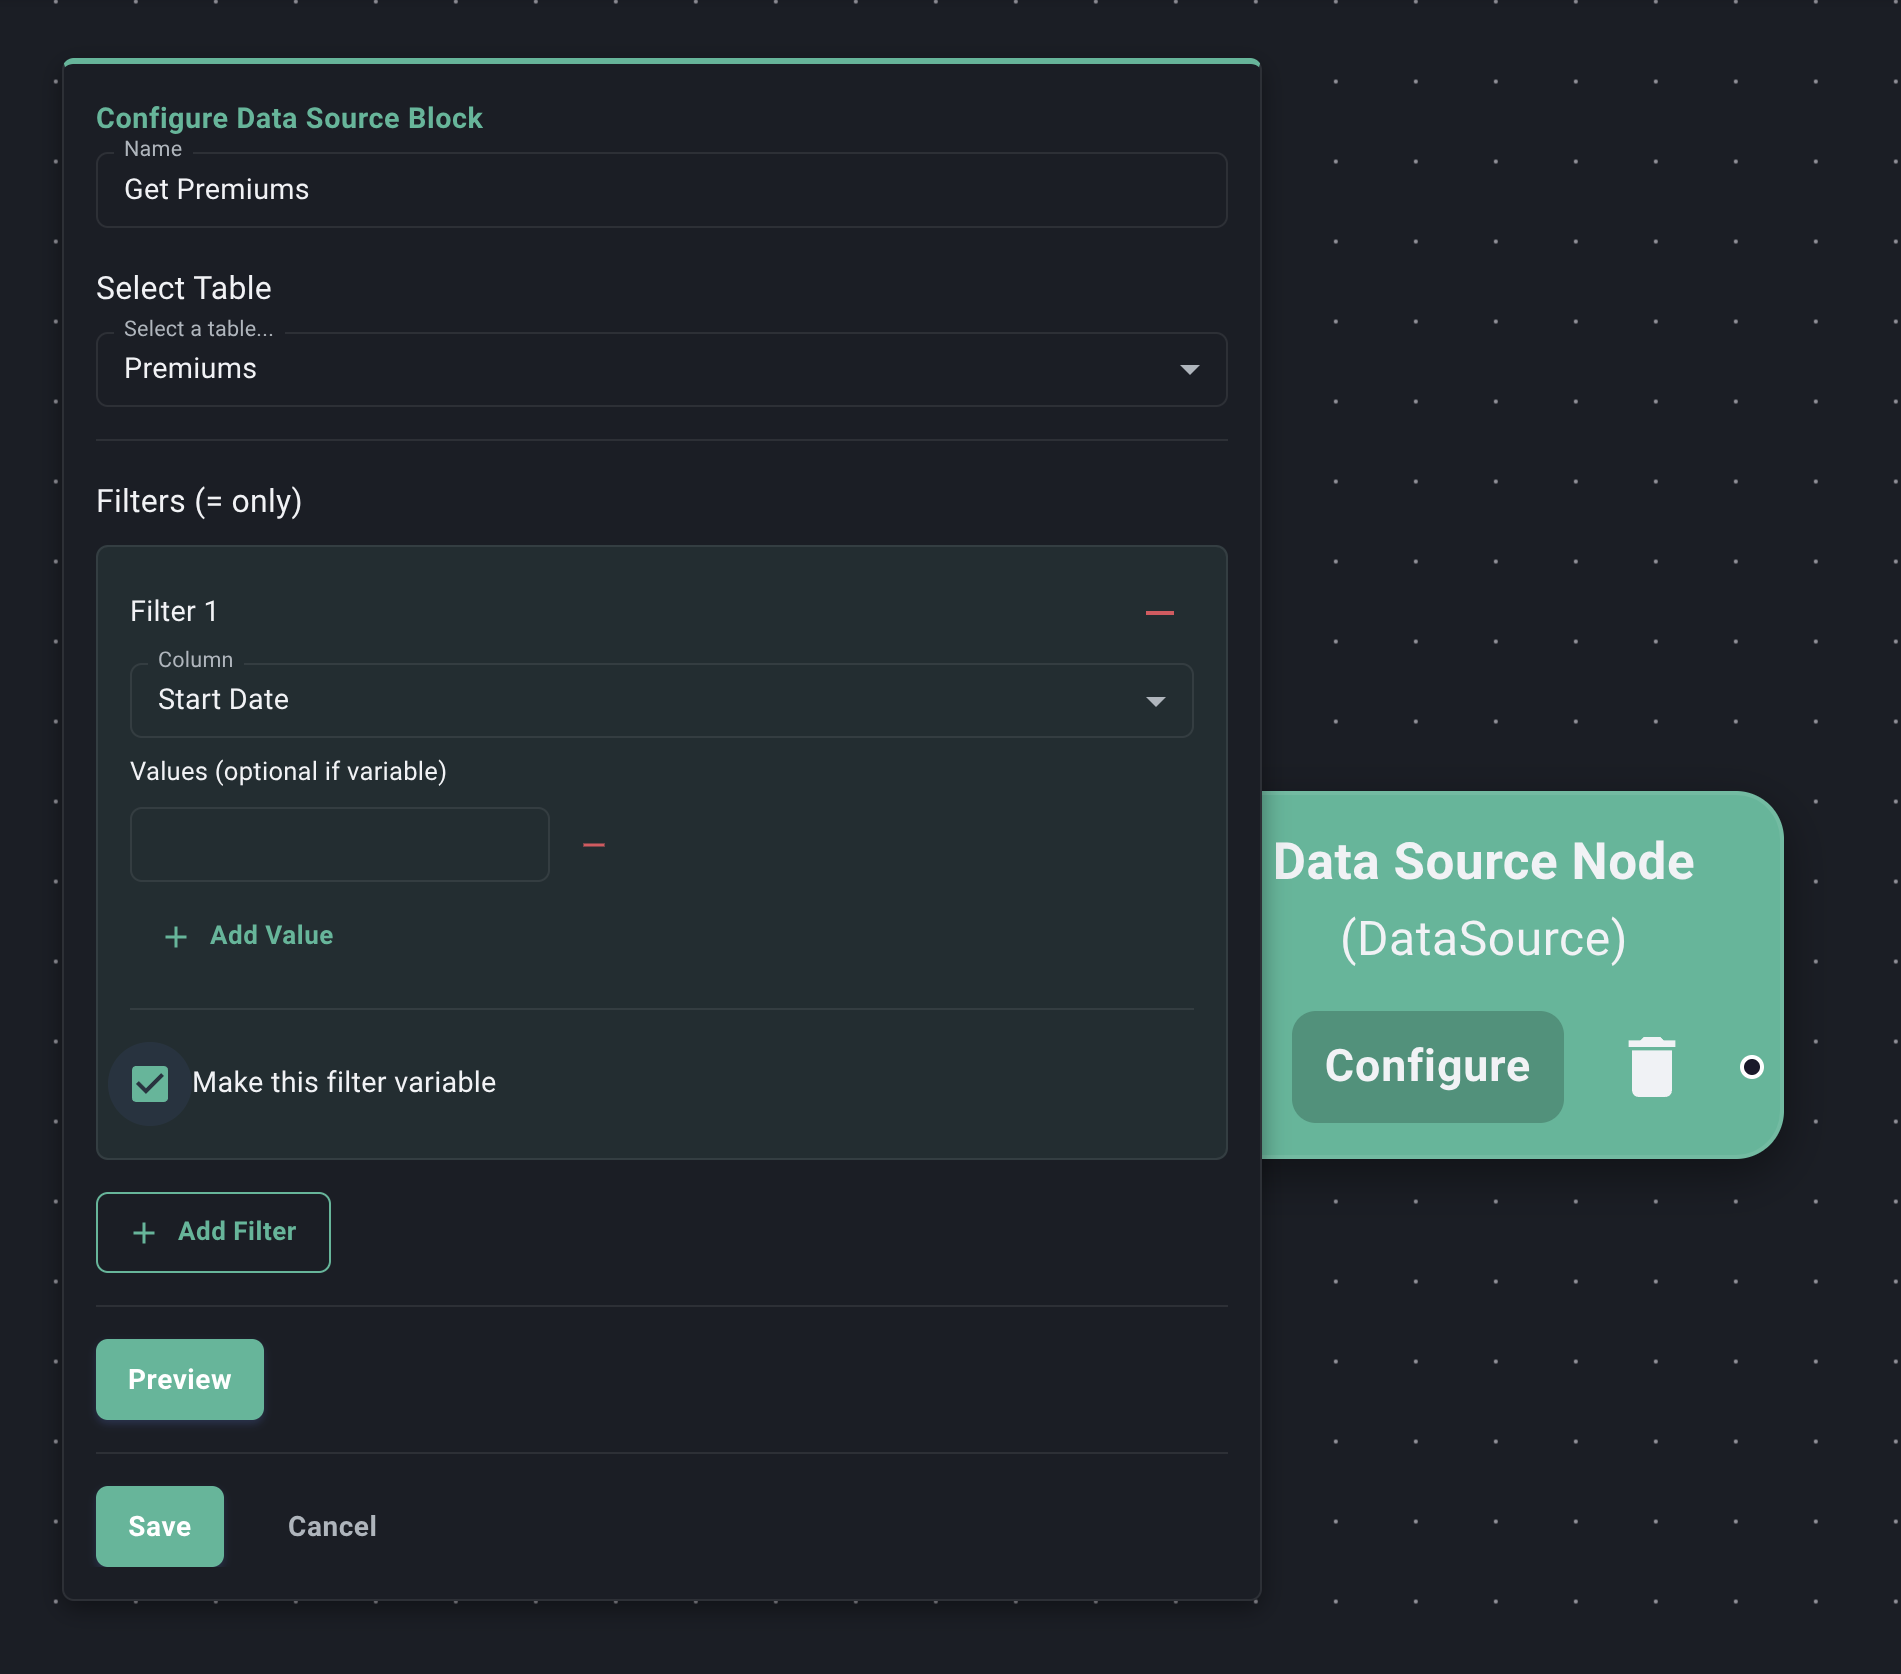
- Open Configuration: Click the "Configure" button on the Data Source node you just added.
- The Data Source Block Configuration panel or dialog will appear.
-
Name (Optional but Recommended): Give this data source step a descriptive name (e.g., "Get Premium Data", "Select Claims FY2023").
-
Select Table: Choose the specific Decode Table you want to pull data from using the "Select a table..." dropdown. This list will contain all the Tables you have created on the Data Page.
-
Define Filters: This is where you specify criteria to narrow down the data retrieved from the table before it moves to the next step in your function.
- Click "Add Filter".
- Column: Select the Table column you want to filter on (e.g.,
Region,Policy_Status,Inception_Date, or special filters likeStart Date,End Date). - Value(s): Enter the specific value(s) to filter by.
- For most columns, you can add multiple values (using the "+" button next to the value field) to filter for rows matching any of those values (e.g., filter
Regionfor "North America" OR "Europe"). - For
Start DateandEnd Date, provide a single date. These are often used to define the time period for your analysis.
- For most columns, you can add multiple values (using the "+" button next to the value field) to filter for rows matching any of those values (e.g., filter
- Make Variable (Checkbox): This is a key feature for reusability!
- If unchecked: The filter value you enter here is fixed. The function will always use this value when running.
- If checked: This filter becomes a parameter. When you run the function later, this filter will appear in the sidebar, allowing you to easily change its value without editing the function itself. Check this box for criteria you expect to change often, like date ranges, specific wholesalers, regions, etc. You can provide optional default values here, which will be pre-filled when running the function.
Set Up Configuration -
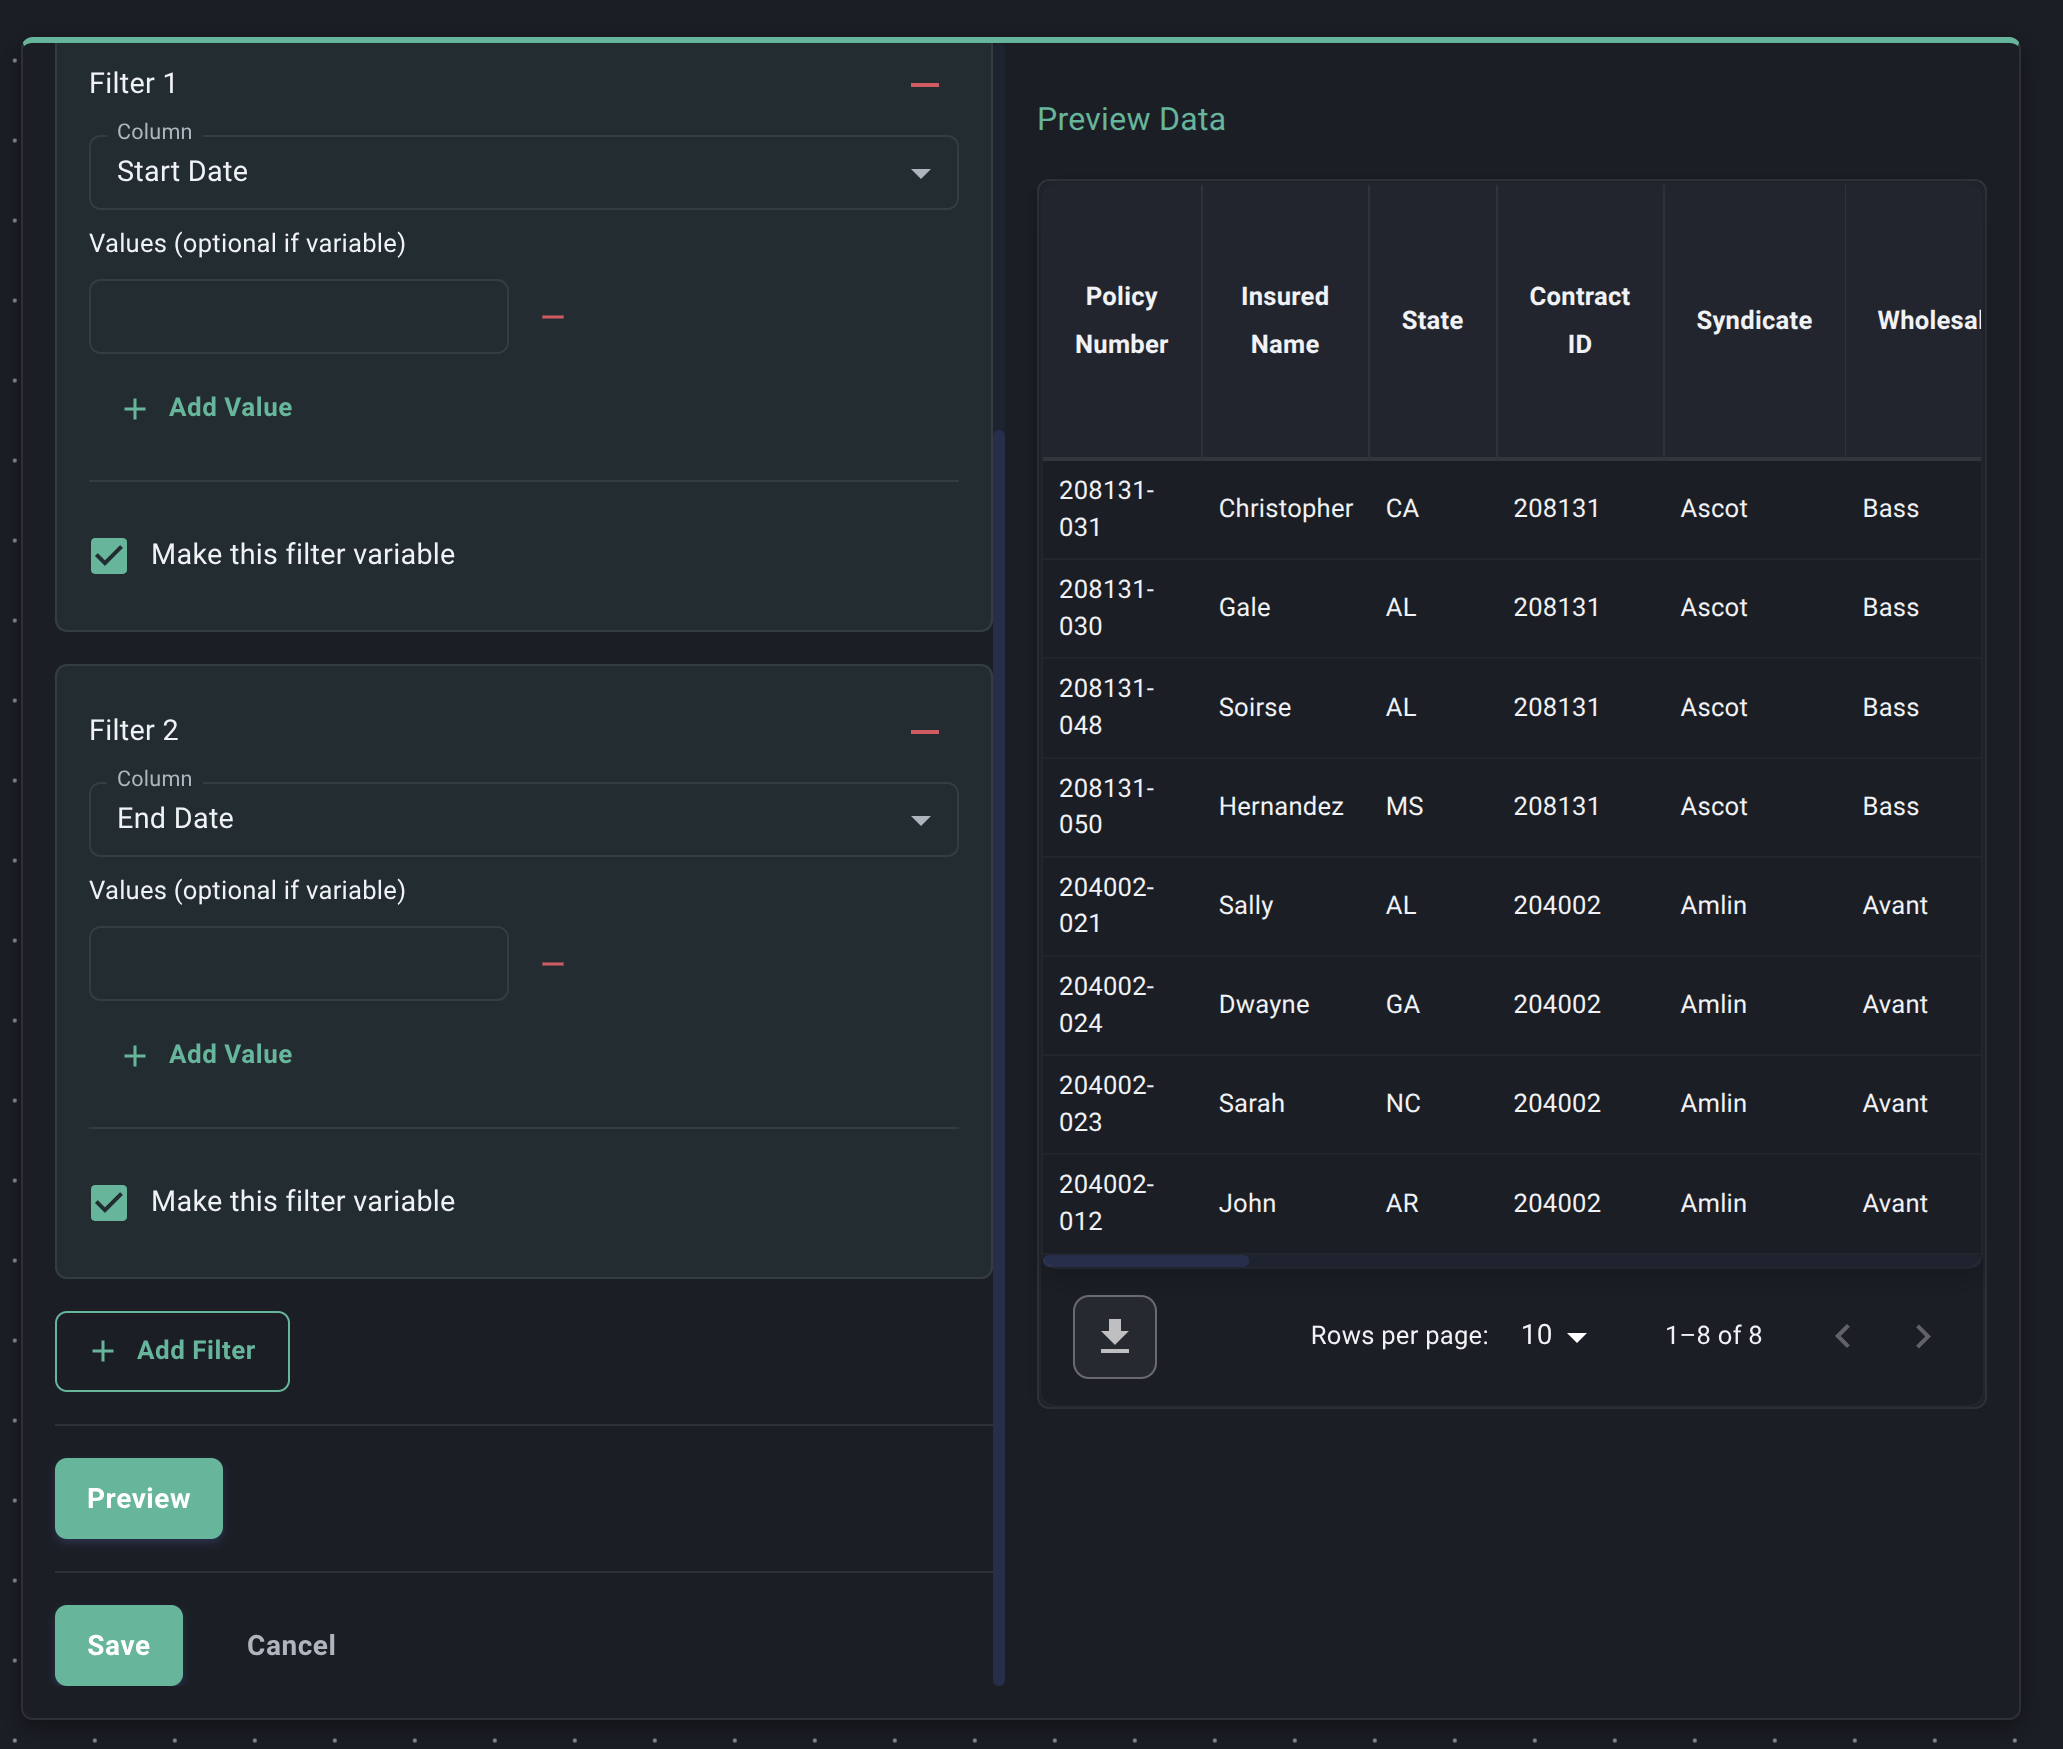
Preview:
- Click the "Preview" button.
- Decode runs a query based on your selected table and non-variable filters (using default values for variable ones if provided) and shows a sample of the data that this node will output.
- Verify: Check the preview table. Does it contain the kind of data you expect based on your filters? This helps catch errors early. You must run a preview after making changes before you can save.
-
Save: Once you are satisfied with the table selection, filters, and preview, click "Save".
The configuration panel will close, and your Data Source node is now set up. It serves as the starting point, providing filtered data to the next node you connect it to.
Next, you'll typically connect this to a Logic Node to perform calculations or transformations.