What are Data Functions?
Data Functions are the core analysis tool within Decode's Dashboard Page. Think of them as reusable, visual pipelines that allow you to:
- Select specific data from one or more of your Tables.
- Filter that data based on criteria you define (some of which can be easily changed each time you run the function).
- Transform and Analyze the data using custom logic (often built with AI assistance) or pre-built tools.
- Visualize the results as tables or charts.
Why Use Data Functions?
Instead of performing one-off analyses in spreadsheets, Data Functions offer several advantages:
- Reusability: Build the analysis logic once, then run it again and again with different parameters (like changing dates or regions) without rebuilding the entire process.
- Consistency: Ensures the same logic is applied every time, reducing manual errors.
- Complexity Handled: Allows for multi-step analyses involving data retrieval, complex calculations, and visualization, all within a single workflow.
- Accessibility: Enables users without strong technical or coding backgrounds to perform sophisticated analysis by leveraging AI assistance for logic creation.
- Parameterization: Easily define inputs (like Start Date, End Date, Wholesaler Name) that can be changed when running the function, allowing you to explore different data slices quickly.
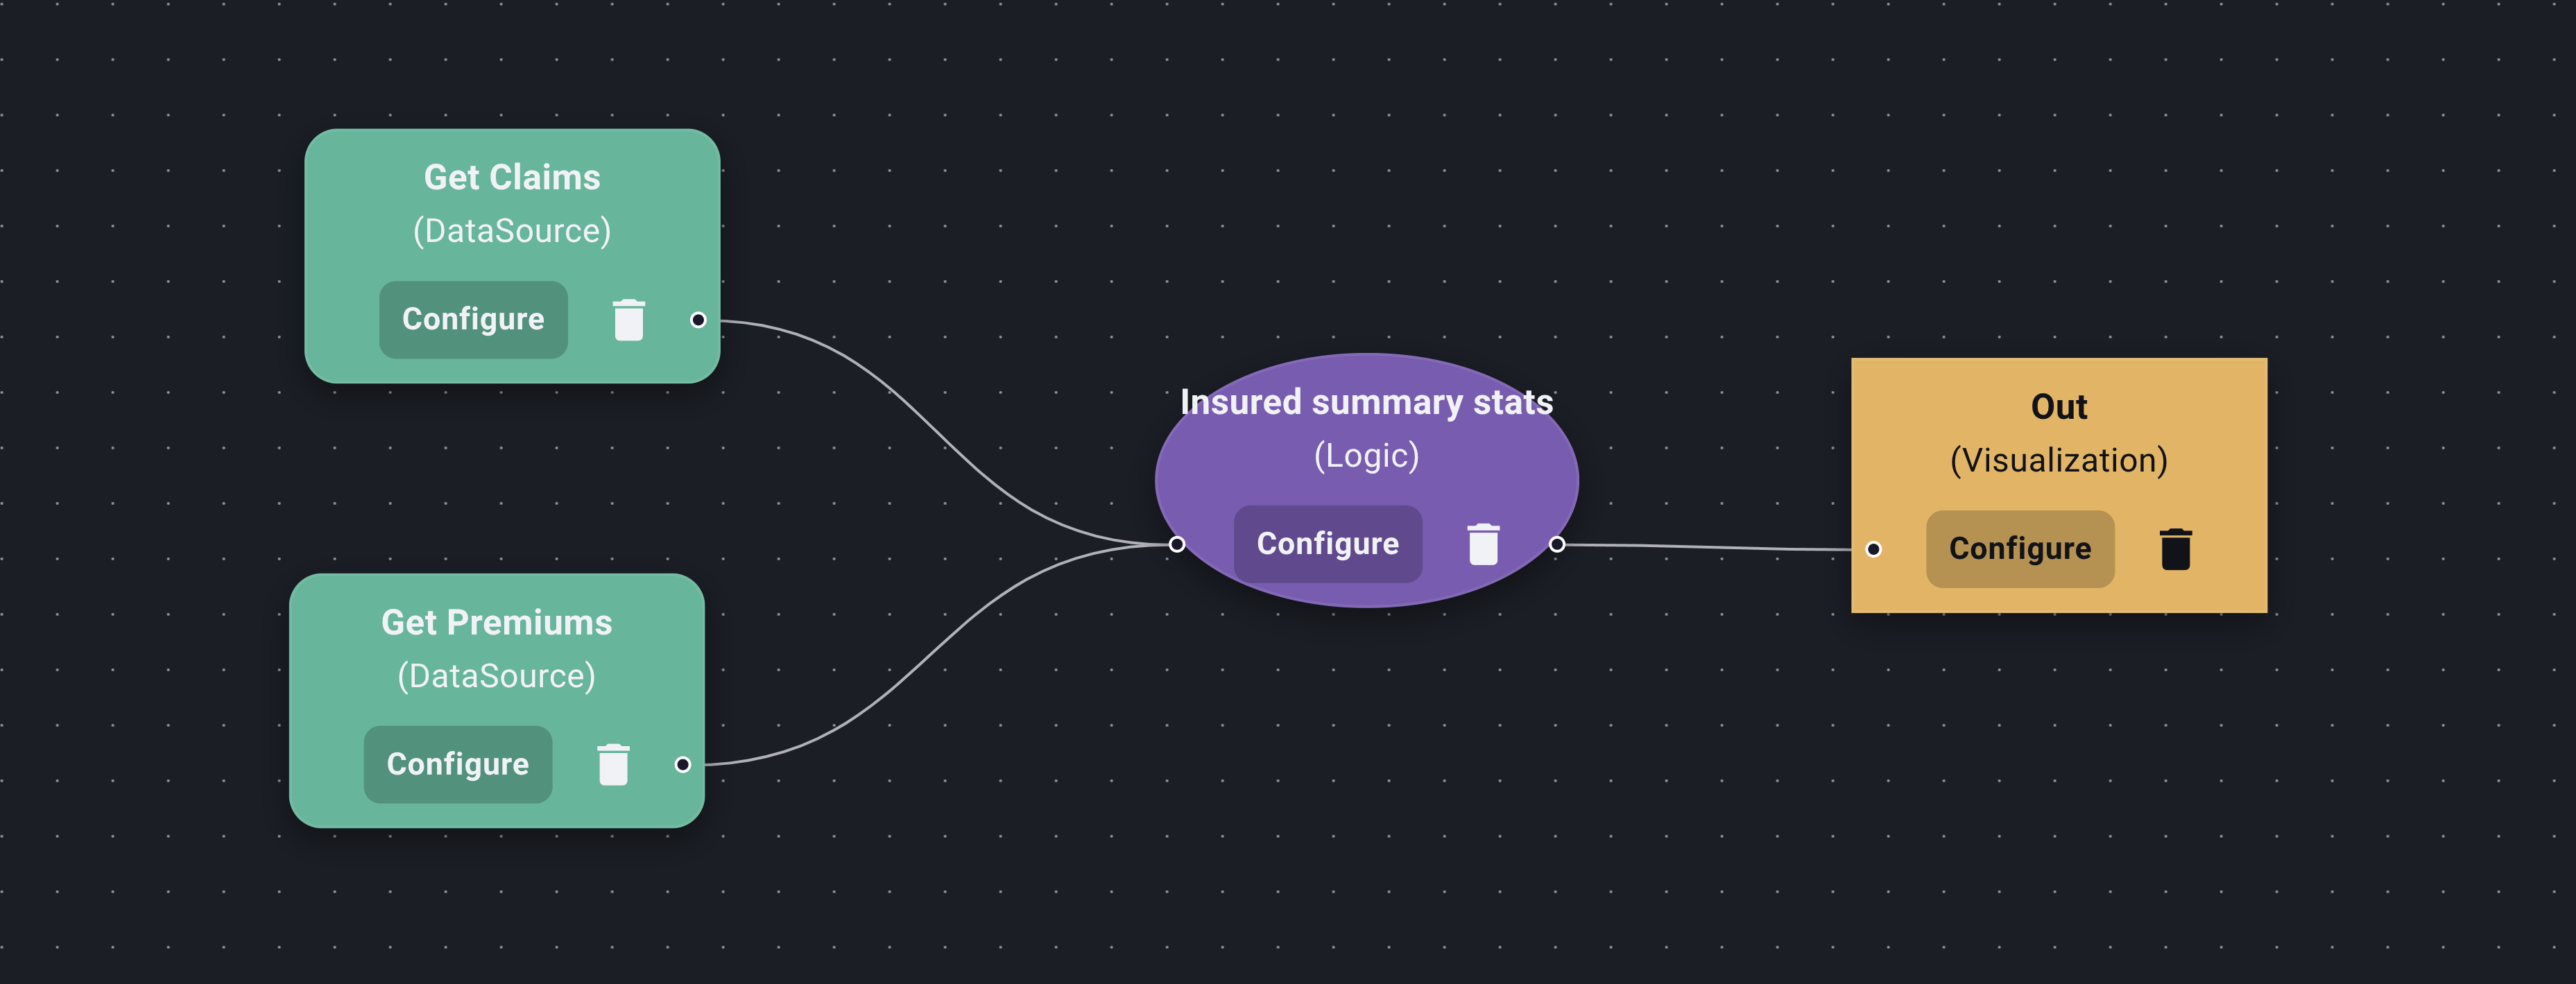
The Flowchart Concept
You build Data Functions visually using a flowchart-like interface. You connect different Nodes, each performing a specific task:
- Data Source Nodes: Specify which Table(s) to pull data from and define initial filters. You can also mark certain filters as parameters that can be changed later when running the function.
- Logic Nodes: Apply custom transformations or calculations. You interact with an AI assistant to define this logic (e.g., "Calculate the loss ratio," "Group by state and sum premiums").
- Predefined Nodes: Integrate specialized, pre-built tools or external API calls into your workflow (e.g., running a list of names through a sanctions check).
- Visualization Nodes: Determine how the final results are displayed – as a data table, a bar chart, or a line chart. AI assistance helps configure chart mappings.
By connecting these nodes, you create a clear, visual representation of your analysis pipeline.
Next, let's walk through Building Your First Function. (This link assumes the next sub-category)