Running Data Functions
Once you have built and finalized a Data Function (status marked as 'Final'), you can run it anytime from the Dashboard Page to perform the analysis and view the results based on current data and specified parameters.
Selecting a Function to Run
- Navigate to the Dashboard Page.
- In the left sidebar, under the "Functions" tab, locate the list of your Final functions. (Draft functions cannot be run directly here; they must be finalized via the builder first).
- Click on the name of the Function you want to run.
What Happens:
- The main content area updates to show the output area for the selected function. Initially, this will be empty or show previous results if any.
- The Parameters Panel appears on the right sidebar, displaying any variable filters you defined in the function's Data Source Node(s).
Using the Parameters Panel
The Parameters Panel is key to the reusability of your Data Functions. It allows you to change the inputs for filters you marked as "variable" during the function building process without needing to edit the function itself.
- Review Parameters: The panel lists parameters grouped by the Data Source Node they belong to (if you named your nodes).
- Modify Values:
- For each parameter you want to change for this specific run, update its value in the corresponding input field.
- Enter dates for date parameters, type text for text parameters, etc. If a parameter allows multiple values (like filtering by multiple regions), enter them separated by commas (e.g.,
CA, NY, TX). - Any default values you set when building the function will be pre-filled.
- Fixed Filters: Filters that were not marked as variable during function creation will not appear in this panel; the function will always use the fixed value defined in the builder.
Running the Function
-
Once you have set the desired parameter values in the right sidebar, click the "Run Function" or "Run All" button.
-
Processing:
- Decode executes the function pipeline in the background.
- It retrieves data from the specified Tables, applying both the fixed filters defined in the function and the current values you just set in the Parameters Panel.
- It processes the data through any Logic or Predefined Nodes.
- A loading indicator will typically appear in the main output area.
-
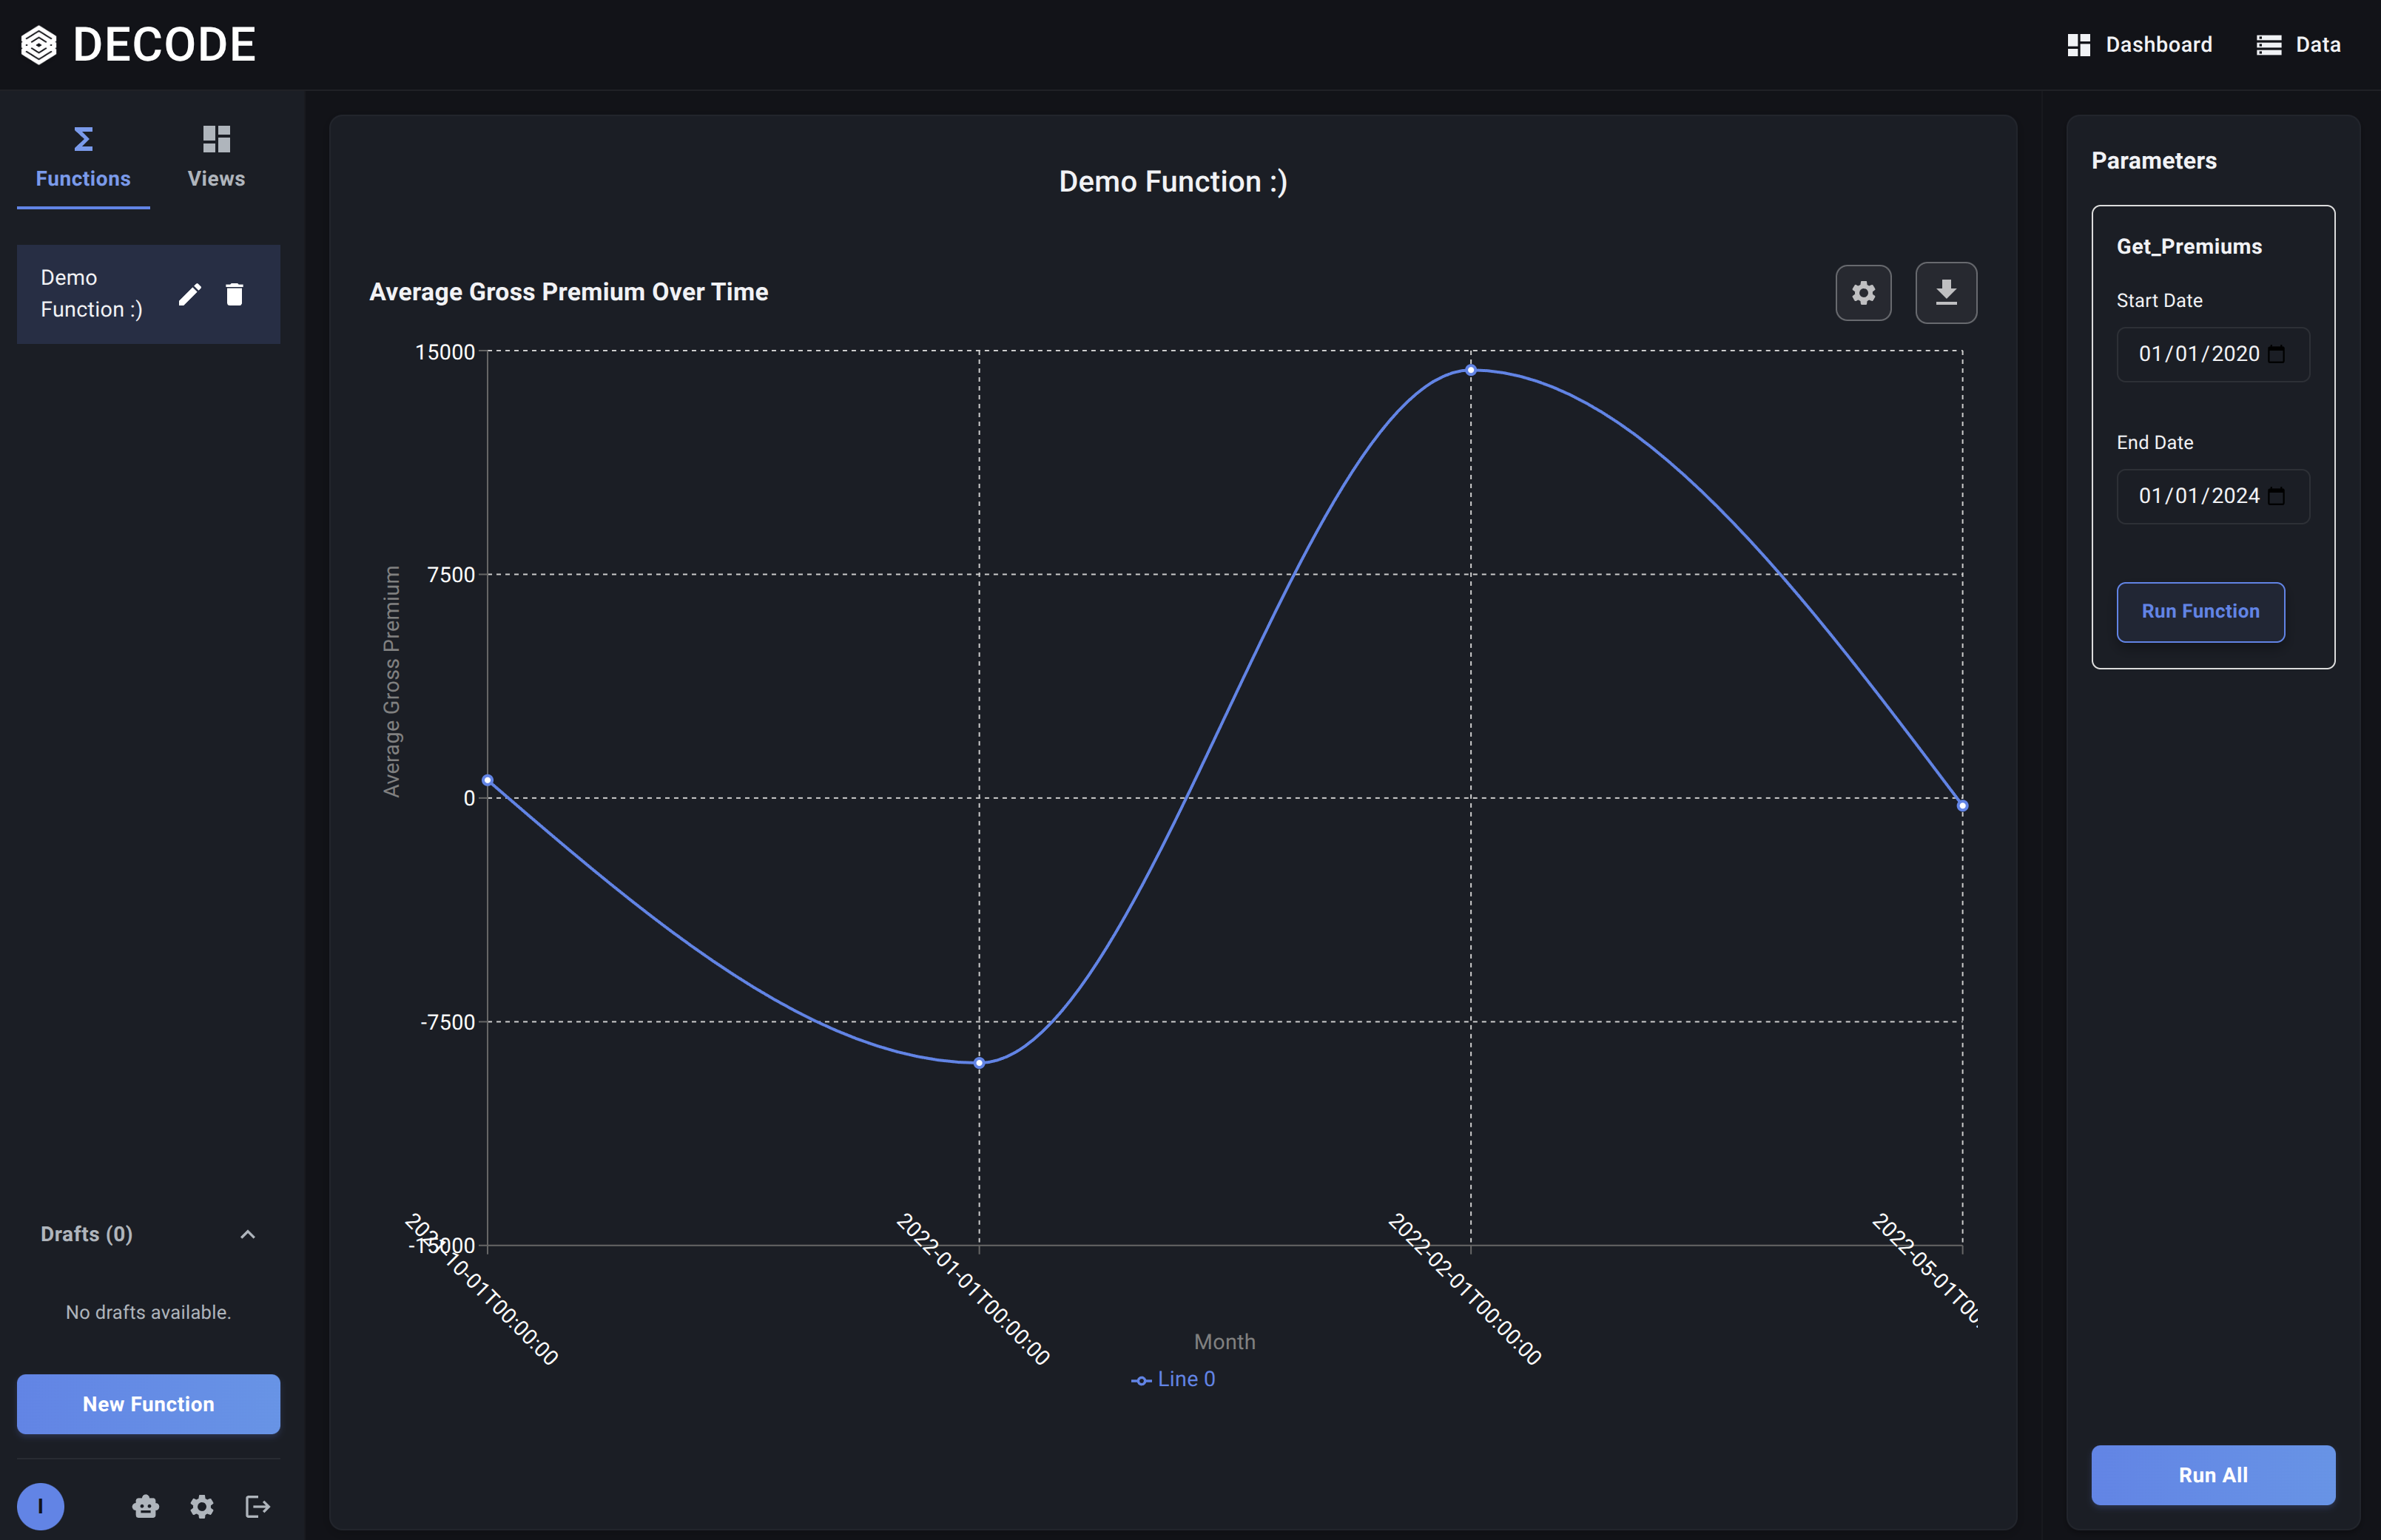
Viewing Results:
- Once execution is complete, the main content area refreshes to display the output generated by the function's Visualization Node(s).
- This could be a data table, a bar chart, a line chart, or potentially multiple outputs if your function includes them.
- If an error occurs during execution, an error message will be displayed instead.
You can change the parameters in the sidebar and click "Run Function" again as many times as needed to explore different data slices or time periods using the same underlying analysis logic.
Next, learn about Managing Your Functions (Drafts, Finalizing, Editing, Deleting).