Using Filters to Explore Data
The Data Table View allows you to analyze the entire dataset composed of the spreadsheets you have uploaded. To analyze specific segments or answer targeted questions, you use the Filter Panel, typically located on the right side of the Data Page.
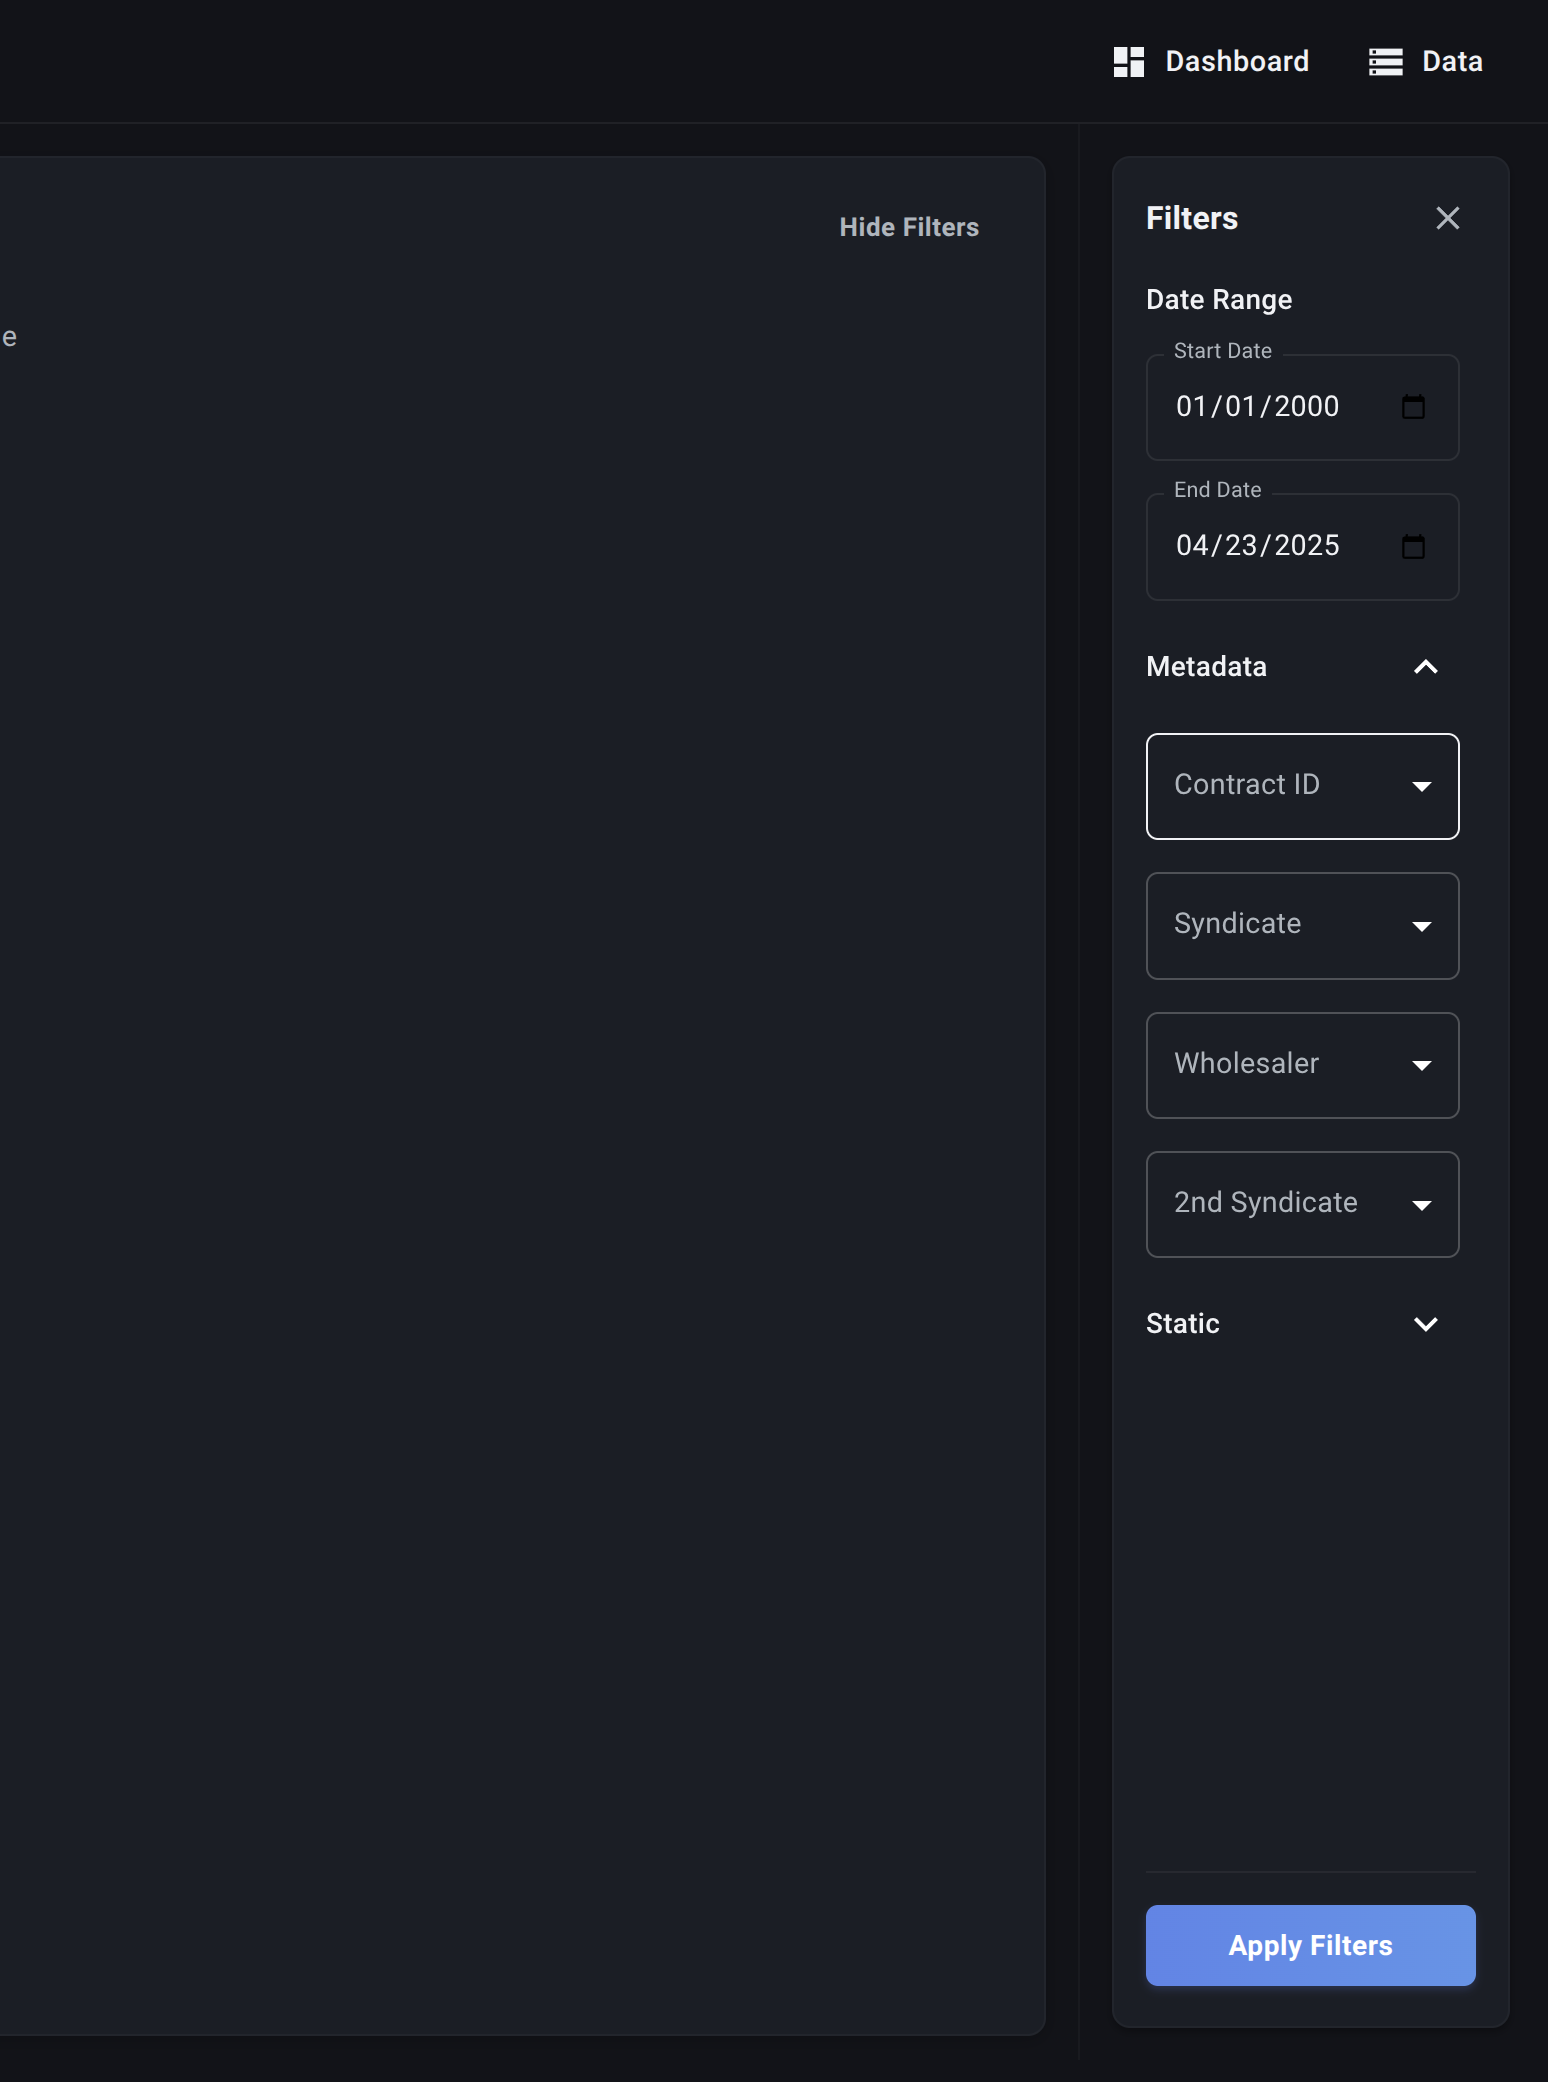
The Filter Panel
When you select a Table, the Filter Panel dynamically updates to show filtering options based on that Table's specific columns:
-
Date Range:
- Start Date / End Date: Allows you to filter the data based on a relevant date column.
-
Attribute Column Filters:
- For each Attribute Column defined in your Table schema, a filter control (multi-select dropdown) appears.
- You can select one or more Values for a category (e.g., select 'Wholesaler A' and 'Wholesaler C' under the
Wholesalerfilter). - The table will show rows matching any of the selected values within that category.
-
Detail Column Filters:
- Filters are also provided for your Detail Columns.
- Text Columns: All detail columns are converted to text, allowing you to enter text to search for matches (e.g., enter "CA" in the
Statefilter).
Applying Filters
- Select Filters: Choose your desired date range and select/enter values in the relevant Attribute and Detail column filters.
- Click "Apply Filters": Press the button at the bottom of the Filter Panel.
Result:
- The Data Table View will refresh, displaying only the rows that match all your specified filter criteria.
- If you selected multiple values within a single Attribute filter dropdown (e.g., two Wholesalers), it shows rows matching either of those values (OR logic within the category).
- Filters across different columns/categories are usually combined with AND logic (e.g., rows must match the selected Wholesaler AND the selected State AND fall within the Date Range).
The Filter Panel is a powerful tool for slicing and dicing your data directly within the Data Page, allowing you to perform quick explorations and verify subsets of your information before potentially building more complex analyses in Data Functions.