Understanding the Data Table View
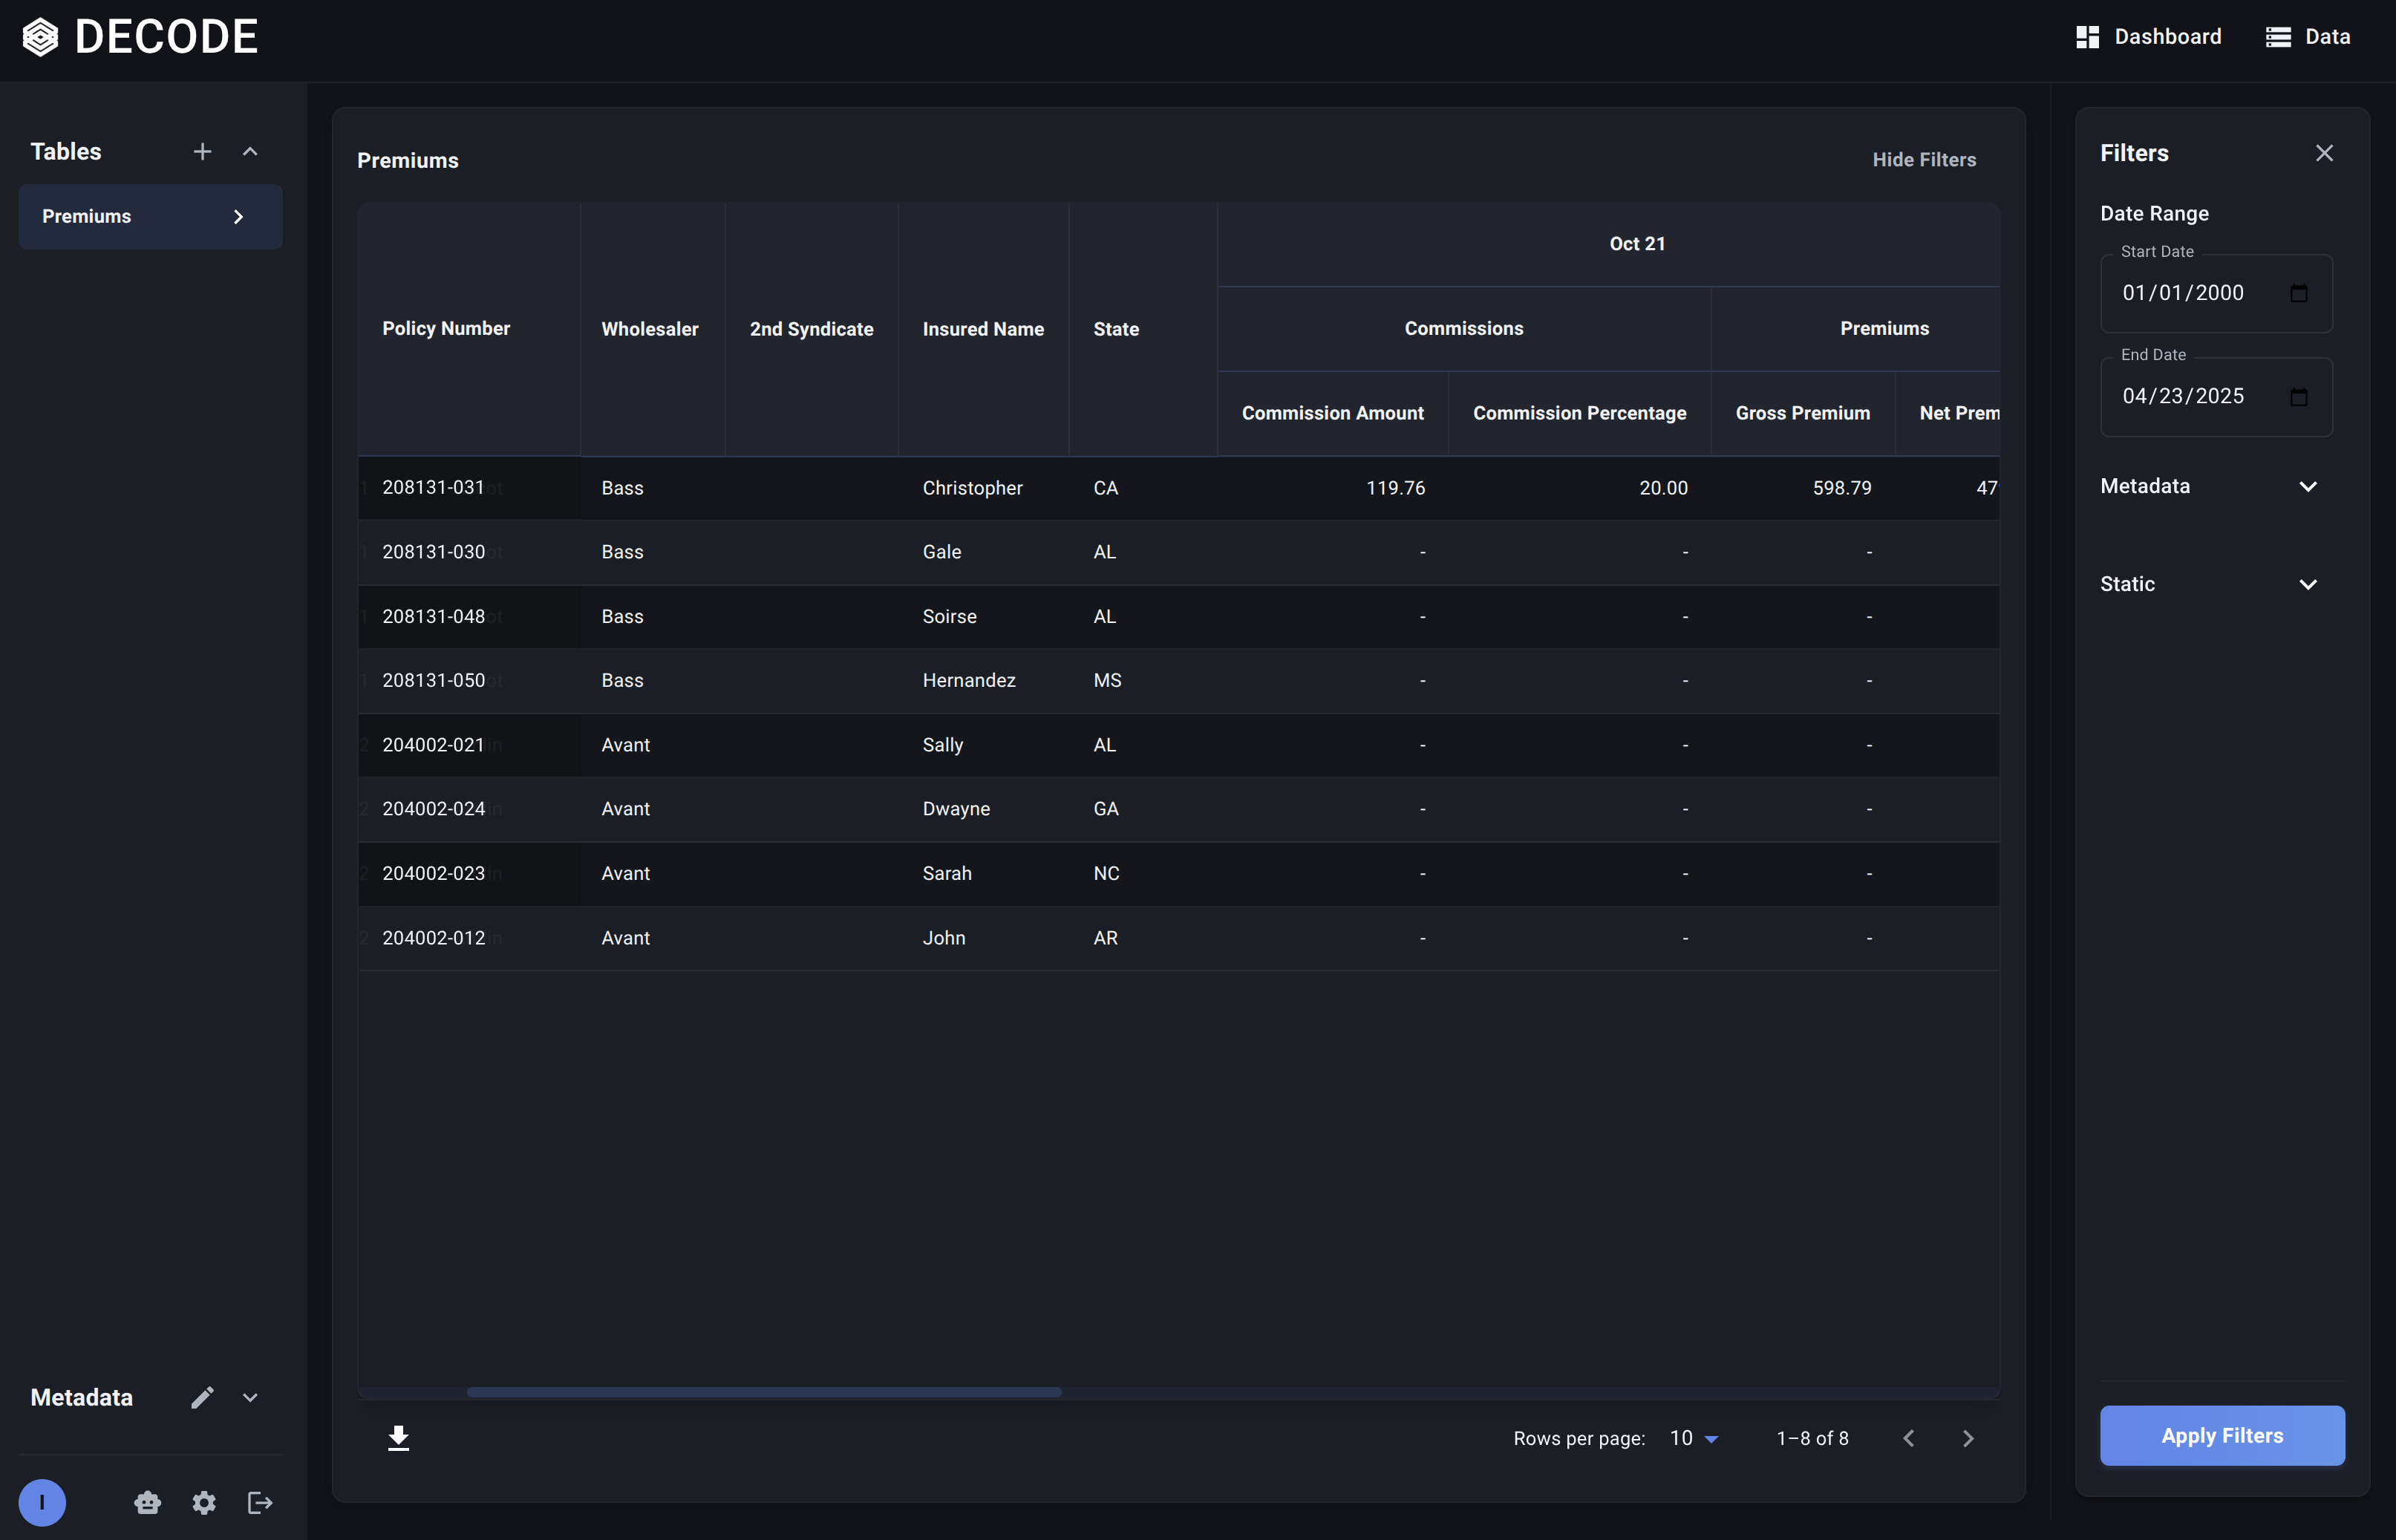
When you select a Table on the Data Page, the main area displays the Data Table View. This is a powerful grid showing your cleaned and structured data, incorporating all the column types you defined: Identifier, Attribute, Detail, and Metric columns (for Time Series tables).
Key Features of the Data Table
- Structured Grid: Presents data in a familiar row-and-column format.
- Column Headers: Displays the names of your Table columns.
- Detail & Attribute Columns: Appear as standard headers.
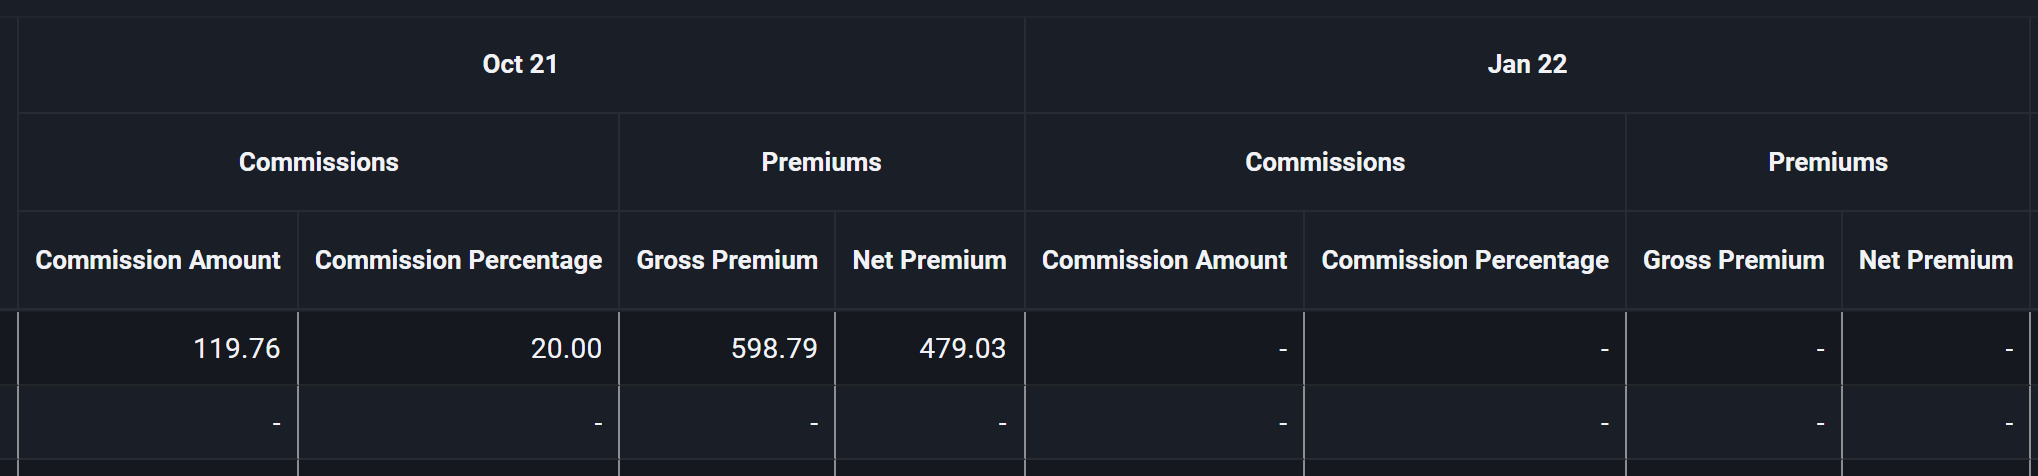
- Metric Columns (Time Series Tables): These are displayed with nested headers to represent the periodic nature and the specific metrics within each period. For example, you might see a main header for 'Jan 24' spanning sub-headers for 'Gross_Premium' and 'Commission'.
- Identifier: The unique key column you defined is typically shown prominently as the first column.
- Attributes: Values for Attribute Columns (assigned during upload via tags/profiles) are shown as columns in each row.
- Metric Data (Time Series Tables): Data from metric columns is laid out chronologically, showing how metrics change over time for each record.
- Pagination: For large tables, the data is displayed in pages (e.g., 10, 25, 50 rows per page) with controls to navigate between pages.
- Horizontal Scrolling: Due to the potential width of tables (especially Time Series tables with many periods), horizontal scrolling is often necessary to view all columns.
- Export: An option is available to export the currently filtered view of the data to an Excel (.xlsx) file.
Interpreting Period Columns (Time Series Tables)
For Time Series tables, period columns are represented with a hierarchical structure:
-
Top-Level Period Header: A header indicates the time period. The format depends on the table's configured period type:
Period Type Display Example Daily Jan 15, 2024 Monthly Jan 24 Quarterly Q1 24 Yearly 2024 -
Nested Metric Headers: Under the period header, you'll see the specific metrics defined in your metric column schema (e.g., 'Gross_Premium', 'Paid_Claims'). If you defined groups, you might see a middle-level header for the group name as well.
-
Cell Values: The cell at the intersection of a specific row (e.g., Policy 123) and a specific nested metric column (e.g., 'Jan 24' > 'Gross_Premium') shows the value of that metric for that record during that period.
This structure allows you to easily track the evolution of key metrics over time for each policy, claim, or other entity identified by the Identifier.
Records Tables
For Records tables (which don't have time-indexed columns), the data view shows a flat table with all your Detail and Attribute columns without the hierarchical period structure. Each row represents a single record in your dataset.
Now that you understand how the data is presented, learn how to drill down into specific subsets using the Filter Panel.