Interacting with Views
Once you have built and saved a View, you can use it as an interactive dashboard to run multiple analyses simultaneously and compare results.
Selecting a View
- Navigate to the Dashboard Page.
- Ensure the "Views" tab is selected in the left sidebar.
- Click on the name of the View you want to open from the list.
What Happens:
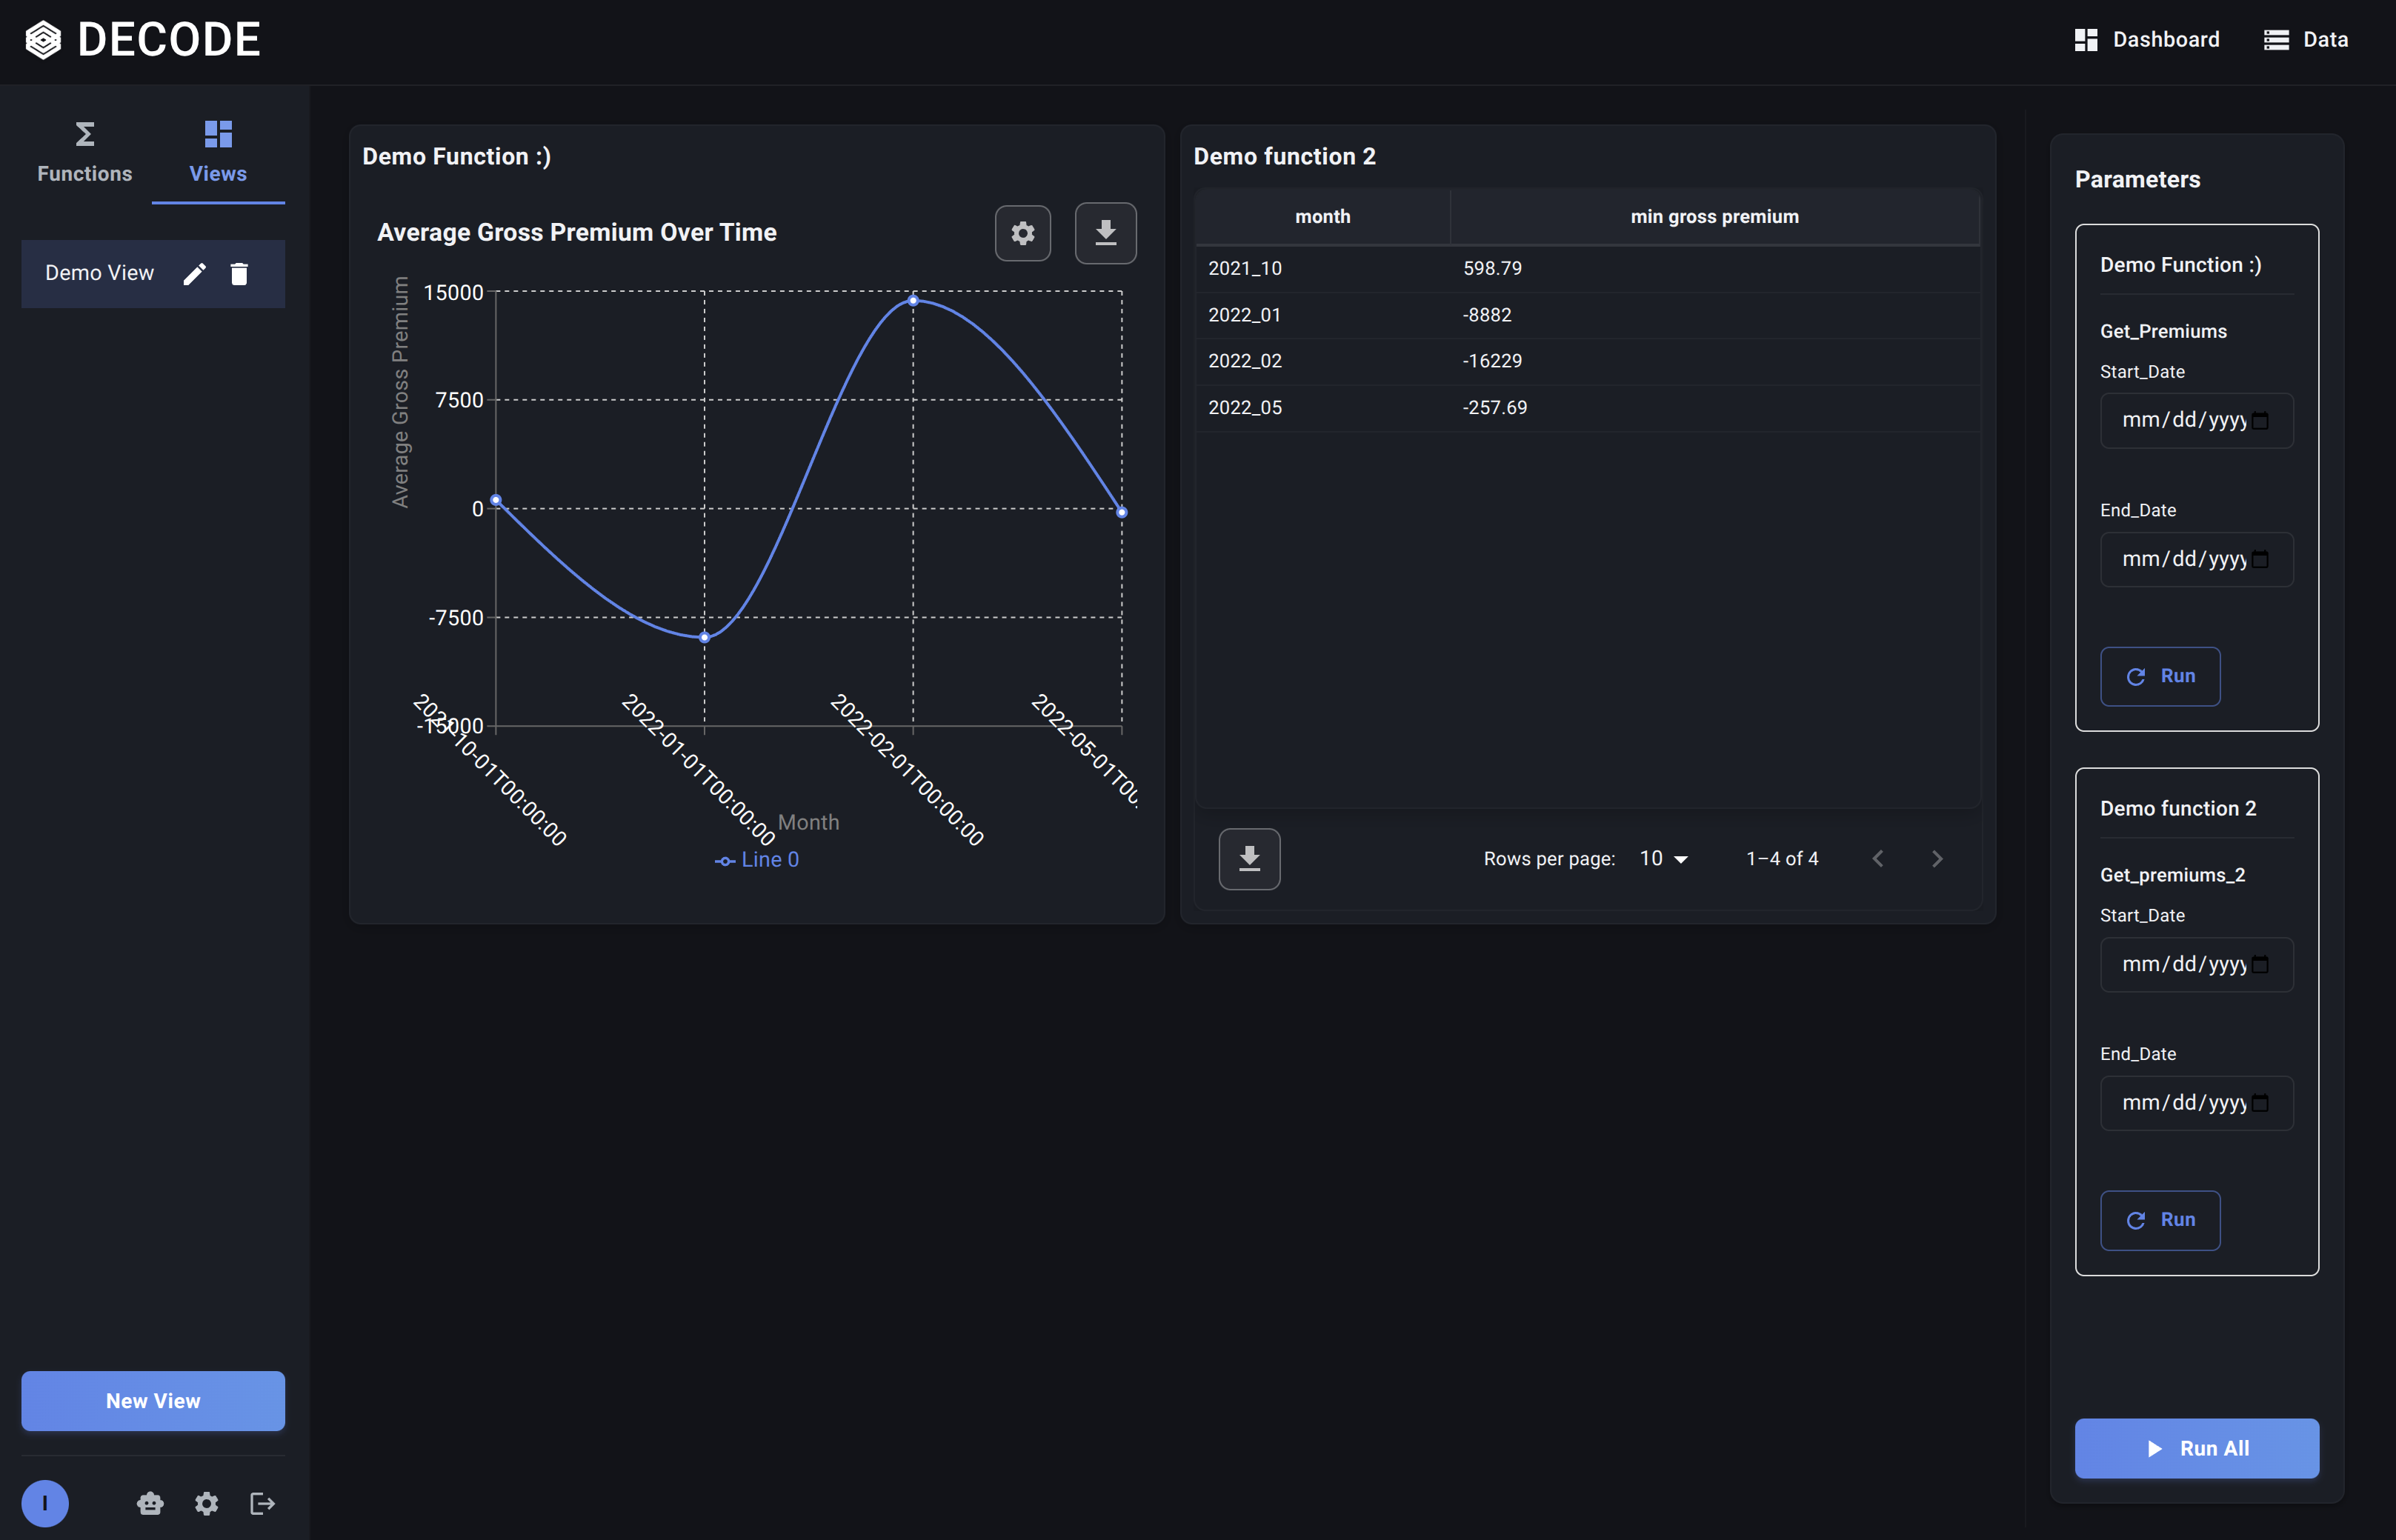
- The main content area updates to display the grid layout you designed, with placeholders or previous results for each Data Function included in the View.
- The Parameters Panel appears on the right sidebar. Crucially, this panel now aggregates the variable parameters from all the functions present in the current View, typically grouped by function instance.
Using the Combined Parameters Panel
The Parameters Panel in a View allows you to control the inputs for all the functions displayed:
- Identify Function Parameters: Parameters are grouped under the name of the function instance they belong to within the View.
- Modify Values: Change the parameter values as needed for your current analysis session, just like when running a single function. You can set different parameters for different instances of the same function if you added it multiple times to the View.
Running Functions within the View
You have two primary ways to execute the analyses:
-
Run All Functions:
- Set all desired parameters in the right sidebar for all functions.
- Click the main "Run All" button (usually at the bottom of the Parameters Panel).
- Decode will execute every Data Function included in the View using the currently set parameters for each.
- Loading indicators will appear in each function's panel on the grid, and they will update with results as they complete. This is ideal for refreshing the entire dashboard.
-
Run a Single Function:
- Set the parameters specifically for the one function instance you want to run or refresh in the Parameters Panel.
- Find the corresponding function's section within the Parameters Panel and click its individual "Run" or "Refresh" button.
- Only that specific function's panel on the grid will show a loading indicator and update with new results. This is useful for iterating on one part of the dashboard without re-running everything.
Viewing Results
As functions complete, their respective panels on the grid will display the output (Table, Bar Chart, Line Chart) defined in their Visualization Node. You can now view and compare these results side-by-side within your custom layout.
Views provide a dynamic way to interact with multiple related analyses, making it easier to spot trends, compare segments, and gain a comprehensive understanding from your data.
Finally, learn about Managing Your Views.