Viewing Your Table Schema
Once you have created a Table in Decode, you can easily view its defined structure, known as the schema. Understanding the schema is helpful for several reasons:
- Verification: Confirming the columns you expect (Identifier, Detail, Attribute, and Metric columns) are set up correctly.
- Upload Preparation: Knowing the exact column names and structure helps ensure your spreadsheets align with the table's expectations before uploading.
- Troubleshooting: If uploads fail or data looks incorrect, reviewing the schema can help identify potential mismatches.
- Collaboration: Sharing the schema with team members ensures everyone understands how the data is organized.
How to View the Schema
- Navigate to the Data Page.
- Find the Table you want to inspect in the list of available tables on the left sidebar.
- Click on the "Schema" button below the table name.
- A dialog or panel will open, displaying the schema details.
Understanding the Schema View
The schema view provides a clear breakdown of your table's structure:
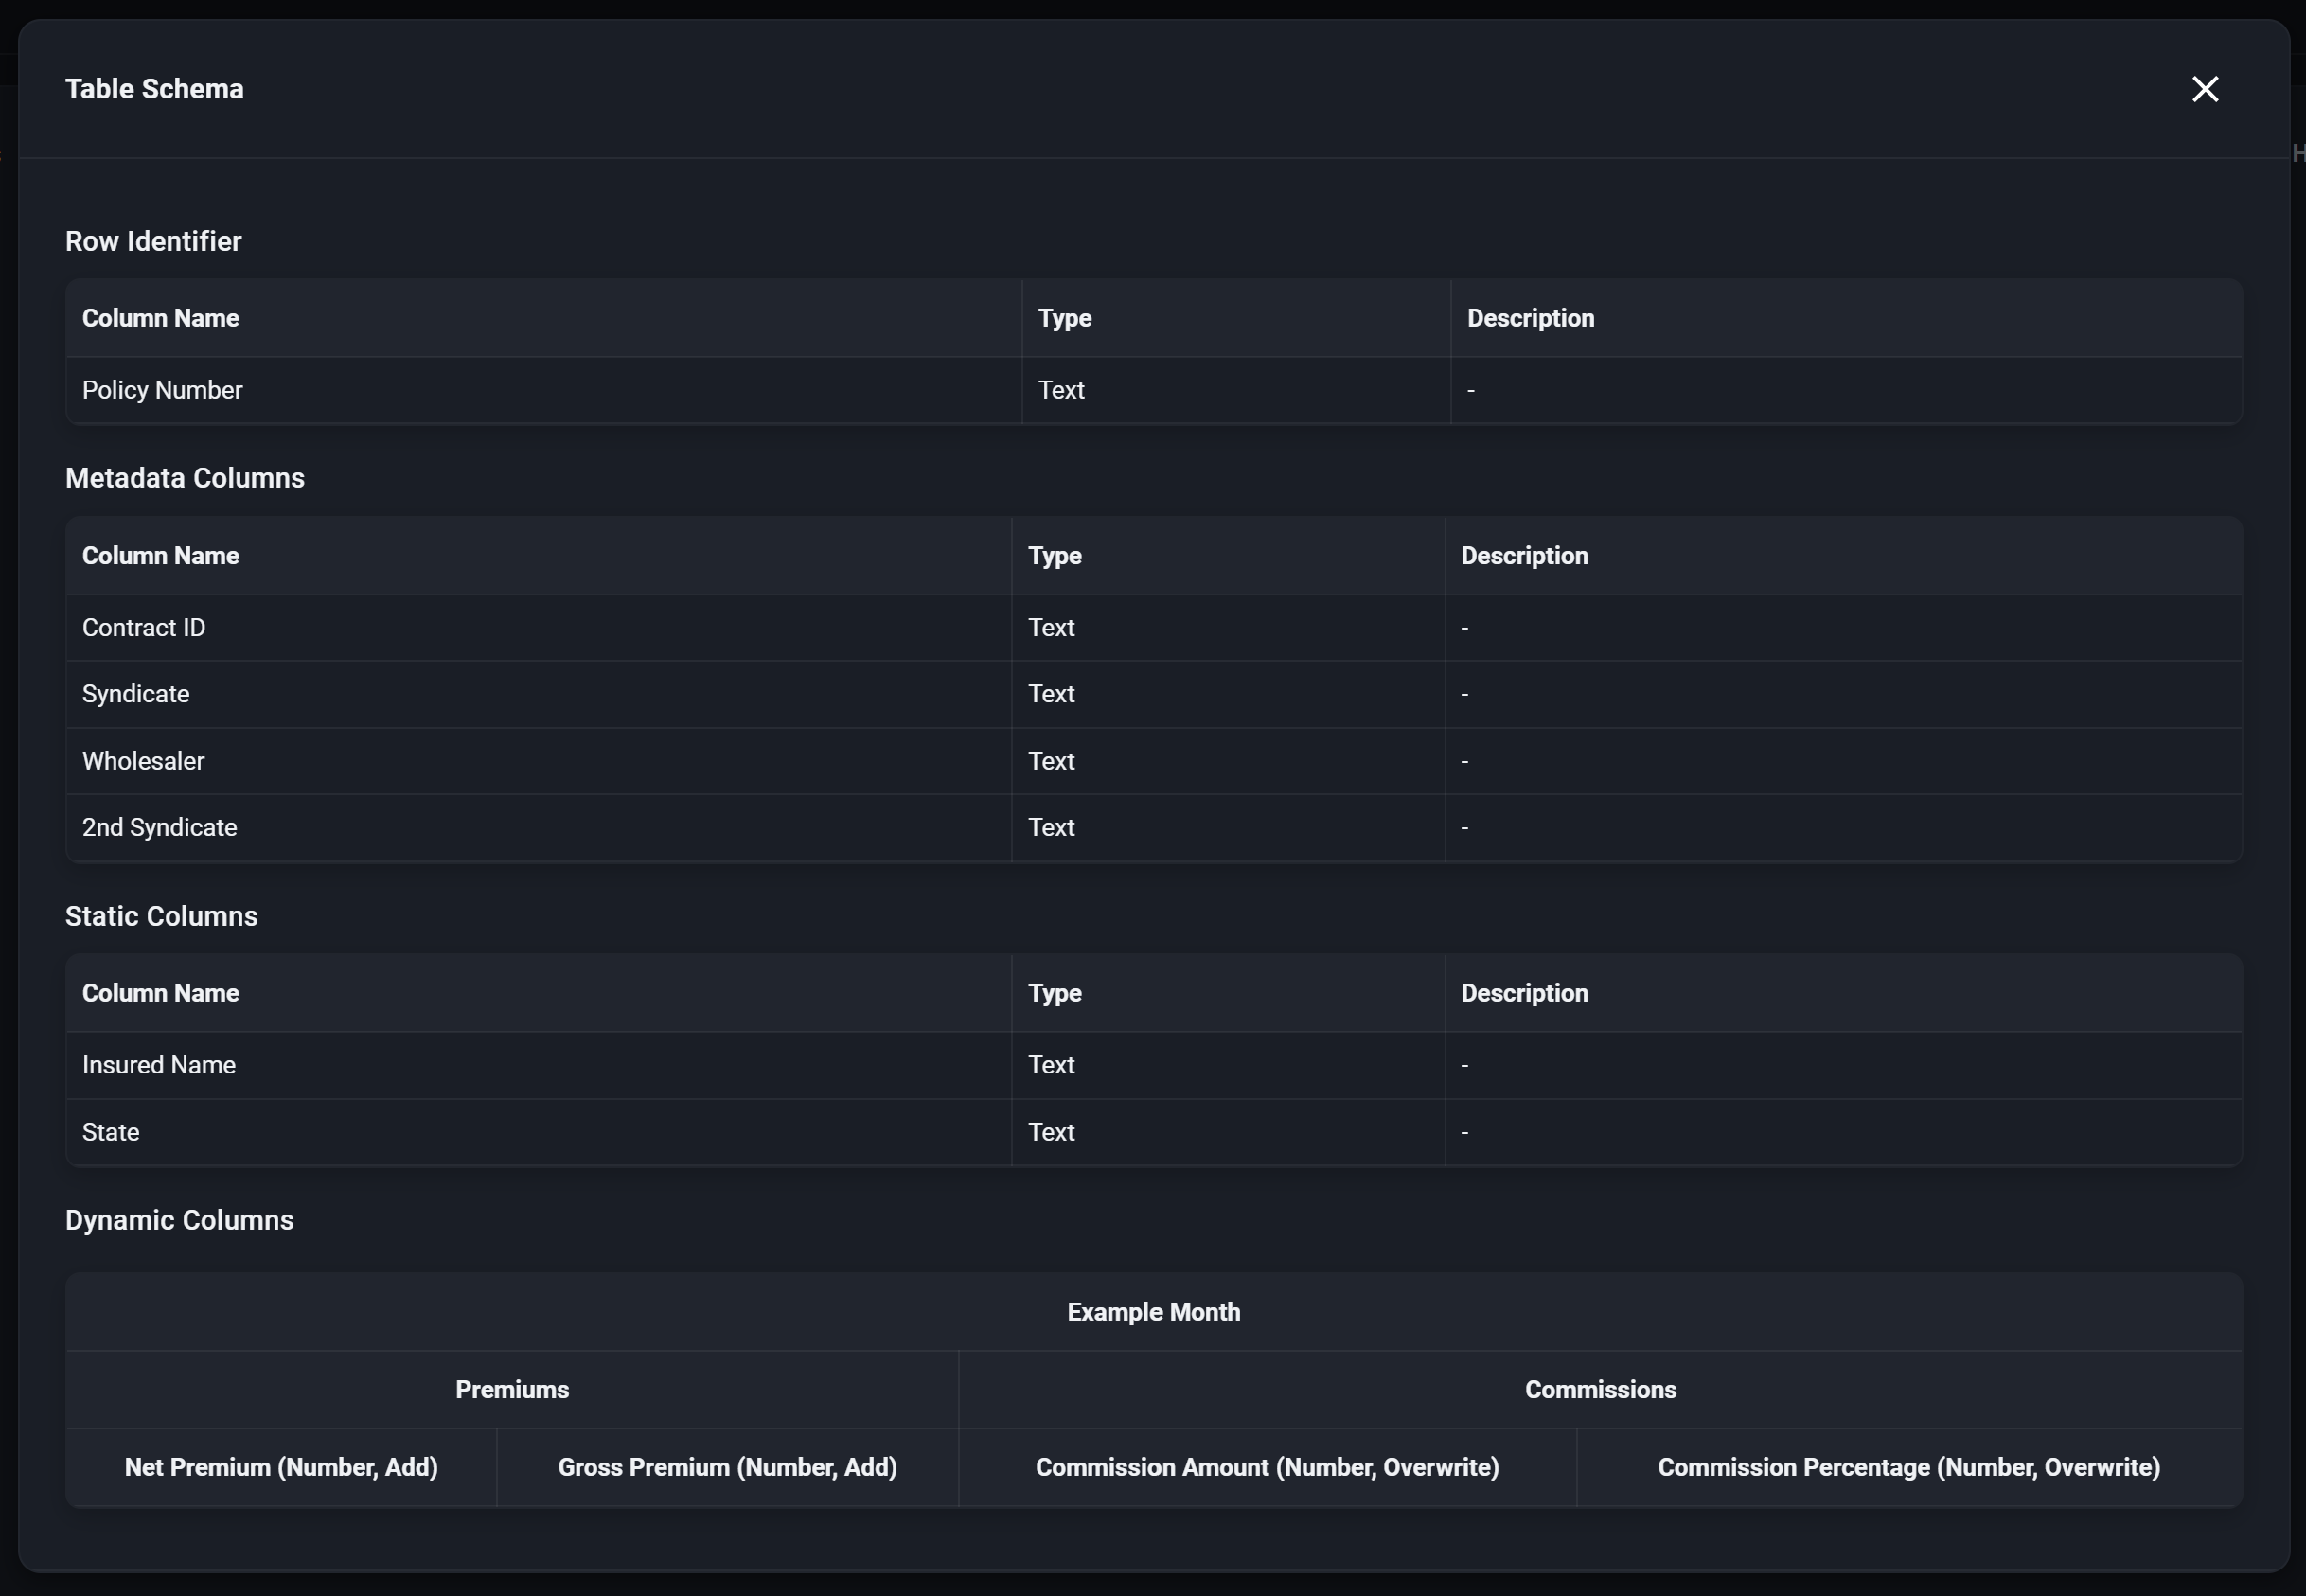
- Table Type: Shows whether this is a Time Series or Records table.
- Time Period (Time Series only): For Time Series tables, shows the configured period type (Daily, Monthly, Quarterly, or Yearly).
- Identifier: The single unique key column for the table is explicitly shown, along with its data type.
- Attribute Columns: Lists all defined attribute columns (tags) associated with this table, including their names and descriptions (if provided).
- Detail Columns: Displays all detail columns, showing their names, data types, and descriptions.
- Metric Columns (Time Series tables only): If you configured a Time Series table with metric columns, this section shows the template structure for your periodic data.
- It will visualize the nesting (if any), displaying group names and individual value names.
- For each metric value, it also shows the defined Type (Number, Text, etc.) and Update Behavior (Overwrite, Add, Subtract).
- An example period column header is shown based on the table's configured time period (e.g., "Jan 24" for monthly, "Q1 24" for quarterly).
This view gives you a complete snapshot of how Decode expects data to be structured for this specific table, both for unchanging details and for data that evolves over time (for Time Series tables).